Immigrants from Japan 1 or more Vehicles in Household
COMPARE
Immigrants from Japan
Select to Compare
1 or more Vehicles in Household
Immigrants from Japan 1 or more Vehicles in Household
88.7%
1+ VEHICLES AVAILABLE
4.9/ 100
METRIC RATING
232nd/ 347
METRIC RANK
Immigrants from Japan 1 or more Vehicles in Household Correlation Chart
The statistical analysis conducted on geographies consisting of 340,026,937 people shows a weak positive correlation between the proportion of Immigrants from Japan and percentage of households with 1 or more vehicles available in the United States with a correlation coefficient (R) of 0.226 and weighted average of 88.7%. On average, for every 1% (one percent) increase in Immigrants from Japan within a typical geography, there is an increase of 0.23% in percentage of households with 1 or more vehicles available.
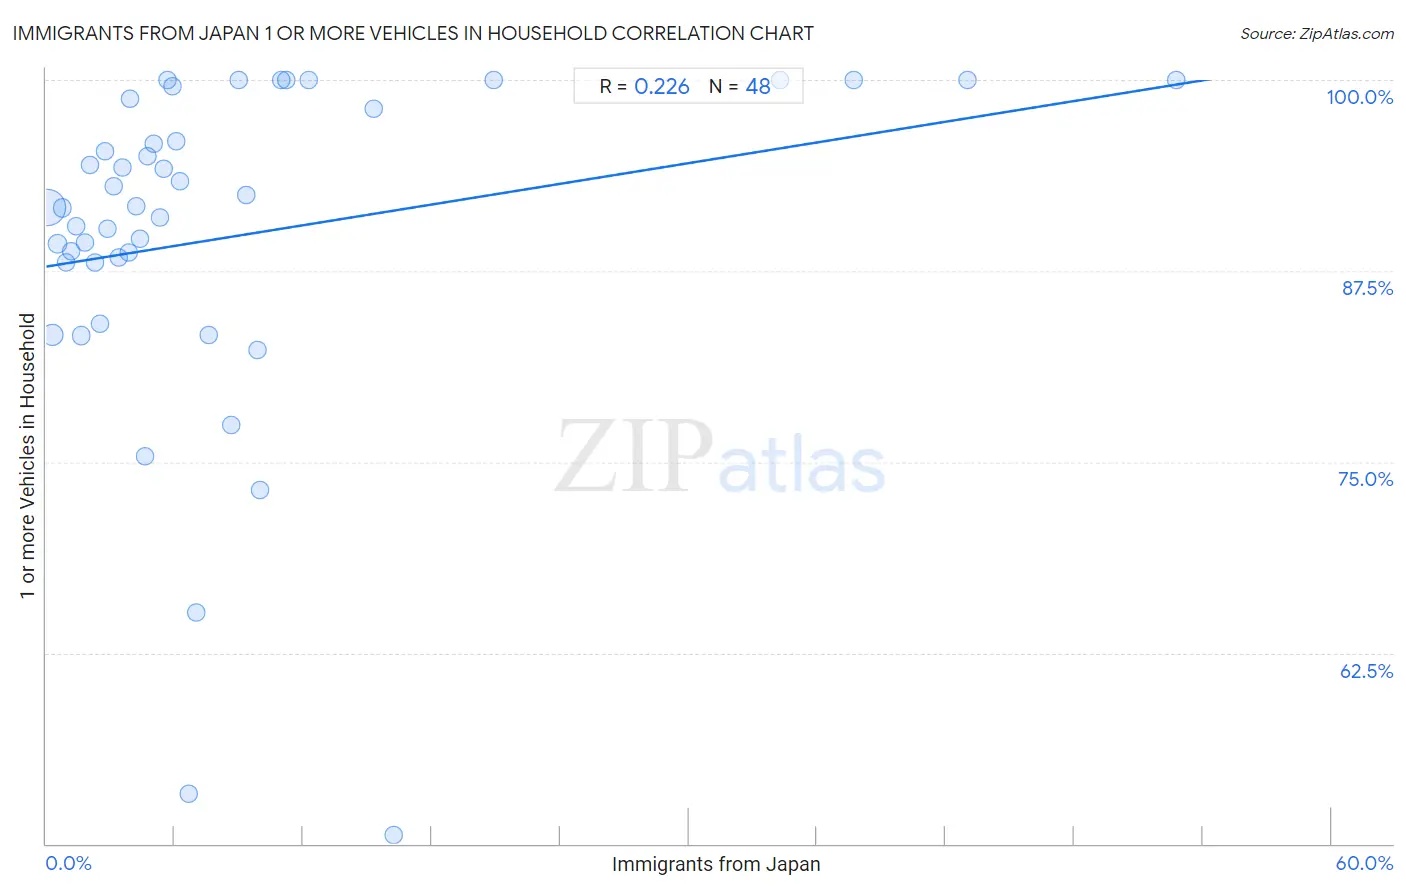
It is essential to understand that the correlation between the percentage of Immigrants from Japan and percentage of households with 1 or more vehicles available does not imply a direct cause-and-effect relationship. It remains uncertain whether the presence of Immigrants from Japan influences an upward or downward trend in the level of percentage of households with 1 or more vehicles available within an area, or if Immigrants from Japan simply ended up residing in those areas with higher or lower levels of percentage of households with 1 or more vehicles available due to other factors.
Demographics Similar to Immigrants from Japan by 1 or more Vehicles in Household
In terms of 1 or more vehicles in household, the demographic groups most similar to Immigrants from Japan are Russian (88.7%, a difference of 0.0%), Houma (88.6%, a difference of 0.010%), Immigrants from Sierra Leone (88.7%, a difference of 0.020%), Immigrants from Peru (88.6%, a difference of 0.020%), and Immigrants from Romania (88.7%, a difference of 0.030%).
| Demographics | Rating | Rank | 1 or more Vehicles in Household |
| Cree | 6.0 /100 | #225 | Tragic 88.7% |
| Cheyenne | 5.7 /100 | #226 | Tragic 88.7% |
| Ute | 5.6 /100 | #227 | Tragic 88.7% |
| Immigrants from Norway | 5.5 /100 | #228 | Tragic 88.7% |
| Immigrants from Romania | 5.4 /100 | #229 | Tragic 88.7% |
| Immigrants from Sierra Leone | 5.2 /100 | #230 | Tragic 88.7% |
| Russians | 5.0 /100 | #231 | Tragic 88.7% |
| Immigrants from Japan | 4.9 /100 | #232 | Tragic 88.7% |
| Houma | 4.8 /100 | #233 | Tragic 88.6% |
| Immigrants from Peru | 4.7 /100 | #234 | Tragic 88.6% |
| Paiute | 4.6 /100 | #235 | Tragic 88.6% |
| Immigrants from Pakistan | 4.5 /100 | #236 | Tragic 88.6% |
| Immigrants from Turkey | 4.4 /100 | #237 | Tragic 88.6% |
| Immigrants from Somalia | 4.2 /100 | #238 | Tragic 88.6% |
| Kiowa | 3.8 /100 | #239 | Tragic 88.6% |
Immigrants from Japan 1 or more Vehicles in Household Correlation Summary
| Measurement | Immigrants from Japan Data | 1 or more Vehicles in Household Data |
| Minimum | 0.077% | 50.5% |
| Maximum | 52.8% | 100.0% |
| Range | 52.7% | 49.5% |
| Mean | 8.7% | 89.8% |
| Median | 5.2% | 91.7% |
| Interquartile 25% (IQ1) | 2.6% | 88.1% |
| Interquartile 75% (IQ3) | 9.6% | 98.4% |
| Interquartile Range (IQR) | 7.0% | 10.4% |
| Standard Deviation (Sample) | 11.2% | 11.2% |
| Standard Deviation (Population) | 11.1% | 11.1% |
Correlation Details
| Immigrants from Japan Percentile | Sample Size | 1 or more Vehicles in Household |
[ 0.0% - 0.5% ] 0.077% | 253,885,538 | 91.7% |
[ 0.0% - 0.5% ] 0.28% | 53,781,005 | 83.3% |
[ 0.5% - 1.0% ] 0.51% | 16,880,209 | 89.3% |
[ 0.5% - 1.0% ] 0.75% | 5,438,618 | 91.6% |
[ 0.5% - 1.0% ] 0.95% | 3,162,886 | 88.0% |
[ 1.0% - 1.5% ] 1.17% | 1,529,860 | 88.8% |
[ 1.0% - 1.5% ] 1.40% | 1,777,640 | 90.4% |
[ 1.5% - 2.0% ] 1.61% | 825,086 | 83.3% |
[ 1.5% - 2.0% ] 1.84% | 473,447 | 89.3% |
[ 2.0% - 2.5% ] 2.04% | 259,944 | 94.4% |
[ 2.0% - 2.5% ] 2.27% | 193,633 | 88.1% |
[ 2.0% - 2.5% ] 2.48% | 96,647 | 84.1% |
[ 2.5% - 3.0% ] 2.75% | 76,003 | 95.3% |
[ 2.5% - 3.0% ] 2.89% | 179,939 | 90.3% |
[ 3.0% - 3.5% ] 3.14% | 72,977 | 93.1% |
[ 3.0% - 3.5% ] 3.36% | 709,019 | 88.4% |
[ 3.5% - 4.0% ] 3.55% | 168,533 | 94.3% |
[ 3.5% - 4.0% ] 3.87% | 30,305 | 88.7% |
[ 3.5% - 4.0% ] 3.92% | 34,879 | 98.8% |
[ 4.0% - 4.5% ] 4.22% | 75,763 | 91.7% |
[ 4.0% - 4.5% ] 4.36% | 4,333 | 89.6% |
[ 4.5% - 5.0% ] 4.63% | 30,697 | 75.3% |
[ 4.5% - 5.0% ] 4.74% | 202,903 | 95.0% |
[ 5.0% - 5.5% ] 5.01% | 37,151 | 95.9% |
[ 5.0% - 5.5% ] 5.32% | 13,751 | 91.0% |
[ 5.0% - 5.5% ] 5.48% | 767 | 94.2% |
[ 5.5% - 6.0% ] 5.69% | 703 | 100.0% |
[ 5.5% - 6.0% ] 5.89% | 543 | 99.6% |
[ 6.0% - 6.5% ] 6.09% | 460 | 96.0% |
[ 6.0% - 6.5% ] 6.24% | 481 | 93.4% |
[ 6.5% - 7.0% ] 6.66% | 7,280 | 53.3% |
[ 7.0% - 7.5% ] 7.02% | 413 | 65.1% |
[ 7.5% - 8.0% ] 7.59% | 42,828 | 83.3% |
[ 8.5% - 9.0% ] 8.62% | 348 | 77.4% |
[ 9.0% - 9.5% ] 9.00% | 100 | 100.0% |
[ 9.0% - 9.5% ] 9.33% | 1,018 | 92.5% |
[ 9.5% - 10.0% ] 9.84% | 61 | 82.4% |
[ 9.5% - 10.0% ] 9.98% | 27,373 | 73.1% |
[ 10.5% - 11.0% ] 10.96% | 73 | 100.0% |
[ 11.0% - 11.5% ] 11.21% | 696 | 100.0% |
[ 12.0% - 12.5% ] 12.23% | 327 | 100.0% |
[ 15.0% - 15.5% ] 15.27% | 1,690 | 98.1% |
[ 16.0% - 16.5% ] 16.25% | 277 | 50.5% |
[ 20.5% - 21.0% ] 20.88% | 91 | 100.0% |
[ 34.0% - 34.5% ] 34.23% | 222 | 100.0% |
[ 37.5% - 38.0% ] 37.70% | 183 | 100.0% |
[ 43.0% - 43.5% ] 43.01% | 93 | 100.0% |
[ 52.5% - 53.0% ] 52.78% | 144 | 100.0% |