Immigrants from Japan Married-couple Households
COMPARE
Immigrants from Japan
Select to Compare
Married-couple Households
Immigrants from Japan Married-couple Households
47.7%
MARRIED-COUPLE HOUSEHOLDS
94.4/ 100
METRIC RATING
108th/ 347
METRIC RANK
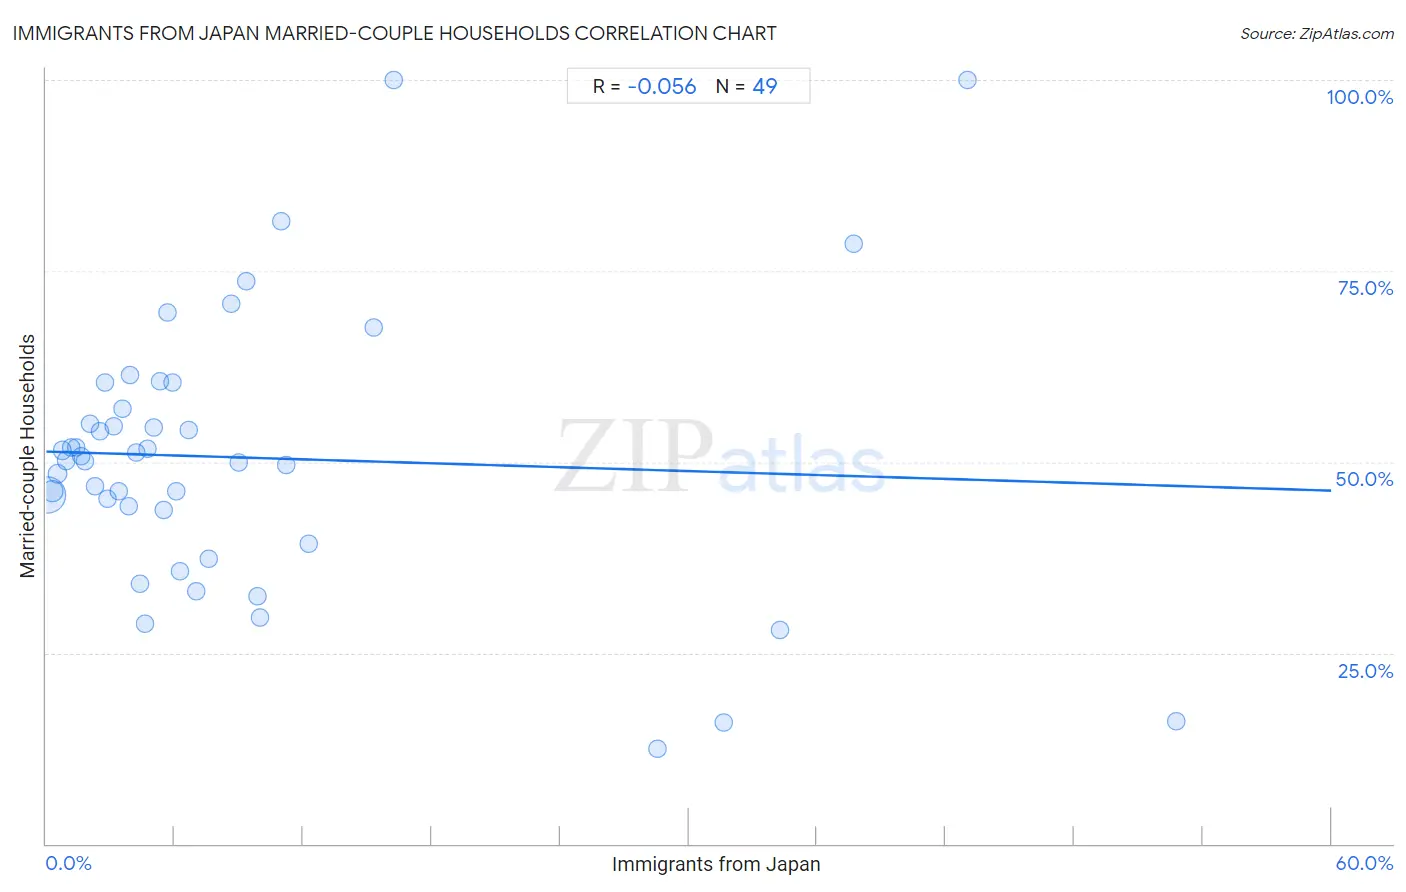
Immigrants from Japan Married-couple Households Correlation Chart
The statistical analysis conducted on geographies consisting of 339,976,257 people shows a slight negative correlation between the proportion of Immigrants from Japan and percentage of married-couple family households in the United States with a correlation coefficient (R) of -0.056 and weighted average of 47.7%. On average, for every 1% (one percent) increase in Immigrants from Japan within a typical geography, there is a decrease of 0.086% in percentage of married-couple family households.
It is essential to understand that the correlation between the percentage of Immigrants from Japan and percentage of married-couple family households does not imply a direct cause-and-effect relationship. It remains uncertain whether the presence of Immigrants from Japan influences an upward or downward trend in the level of percentage of married-couple family households within an area, or if Immigrants from Japan simply ended up residing in those areas with higher or lower levels of percentage of married-couple family households due to other factors.
Demographics Similar to Immigrants from Japan by Married-couple Households
In terms of married-couple households, the demographic groups most similar to Immigrants from Japan are Estonian (47.7%, a difference of 0.050%), Immigrants from Jordan (47.7%, a difference of 0.050%), Macedonian (47.6%, a difference of 0.070%), Syrian (47.6%, a difference of 0.080%), and Peruvian (47.6%, a difference of 0.090%).
| Demographics | Rating | Rank | Married-couple Households |
| Turks | 96.1 /100 | #101 | Exceptional 47.8% |
| Slavs | 96.0 /100 | #102 | Exceptional 47.8% |
| Hawaiians | 96.0 /100 | #103 | Exceptional 47.8% |
| Immigrants from South Africa | 96.0 /100 | #104 | Exceptional 47.8% |
| Immigrants from Czechoslovakia | 95.5 /100 | #105 | Exceptional 47.8% |
| Portuguese | 95.5 /100 | #106 | Exceptional 47.8% |
| Estonians | 94.7 /100 | #107 | Exceptional 47.7% |
| Immigrants from Japan | 94.4 /100 | #108 | Exceptional 47.7% |
| Immigrants from Jordan | 94.1 /100 | #109 | Exceptional 47.7% |
| Macedonians | 93.9 /100 | #110 | Exceptional 47.6% |
| Syrians | 93.9 /100 | #111 | Exceptional 47.6% |
| Peruvians | 93.8 /100 | #112 | Exceptional 47.6% |
| Venezuelans | 93.8 /100 | #113 | Exceptional 47.6% |
| Immigrants from Europe | 93.7 /100 | #114 | Exceptional 47.6% |
| Slovaks | 92.9 /100 | #115 | Exceptional 47.6% |
Immigrants from Japan Married-couple Households Correlation Summary
| Measurement | Immigrants from Japan Data | Married-couple Households Data |
| Minimum | 0.077% | 12.5% |
| Maximum | 52.8% | 100.0% |
| Range | 52.7% | 87.5% |
| Mean | 9.4% | 50.6% |
| Median | 5.3% | 50.2% |
| Interquartile 25% (IQ1) | 2.6% | 41.5% |
| Interquartile 75% (IQ3) | 9.9% | 58.7% |
| Interquartile Range (IQR) | 7.3% | 17.2% |
| Standard Deviation (Sample) | 11.8% | 18.1% |
| Standard Deviation (Population) | 11.7% | 17.9% |
Correlation Details
| Immigrants from Japan Percentile | Sample Size | Married-couple Households |
[ 0.0% - 0.5% ] 0.077% | 253,861,564 | 45.7% |
[ 0.0% - 0.5% ] 0.28% | 53,771,220 | 46.2% |
[ 0.5% - 1.0% ] 0.51% | 16,873,531 | 48.4% |
[ 0.5% - 1.0% ] 0.75% | 5,430,371 | 51.5% |
[ 0.5% - 1.0% ] 0.95% | 3,162,886 | 50.2% |
[ 1.0% - 1.5% ] 1.17% | 1,529,860 | 52.0% |
[ 1.0% - 1.5% ] 1.40% | 1,777,640 | 51.9% |
[ 1.5% - 2.0% ] 1.61% | 825,086 | 50.8% |
[ 1.5% - 2.0% ] 1.84% | 470,842 | 50.1% |
[ 2.0% - 2.5% ] 2.04% | 259,944 | 55.0% |
[ 2.0% - 2.5% ] 2.27% | 193,633 | 46.8% |
[ 2.0% - 2.5% ] 2.48% | 96,647 | 53.9% |
[ 2.5% - 3.0% ] 2.75% | 76,003 | 60.4% |
[ 2.5% - 3.0% ] 2.89% | 179,939 | 45.1% |
[ 3.0% - 3.5% ] 3.14% | 72,977 | 54.6% |
[ 3.0% - 3.5% ] 3.36% | 709,019 | 46.2% |
[ 3.5% - 4.0% ] 3.55% | 168,533 | 57.0% |
[ 3.5% - 4.0% ] 3.87% | 30,305 | 44.1% |
[ 3.5% - 4.0% ] 3.92% | 34,879 | 61.4% |
[ 4.0% - 4.5% ] 4.22% | 75,763 | 51.3% |
[ 4.0% - 4.5% ] 4.36% | 4,333 | 34.1% |
[ 4.5% - 5.0% ] 4.63% | 30,697 | 28.8% |
[ 4.5% - 5.0% ] 4.74% | 202,903 | 51.7% |
[ 5.0% - 5.5% ] 5.01% | 37,151 | 54.4% |
[ 5.0% - 5.5% ] 5.32% | 13,751 | 60.5% |
[ 5.0% - 5.5% ] 5.48% | 767 | 43.7% |
[ 5.5% - 6.0% ] 5.69% | 703 | 69.6% |
[ 5.5% - 6.0% ] 5.89% | 543 | 60.3% |
[ 6.0% - 6.5% ] 6.09% | 460 | 46.2% |
[ 6.0% - 6.5% ] 6.24% | 481 | 35.7% |
[ 6.5% - 7.0% ] 6.66% | 7,280 | 54.1% |
[ 7.0% - 7.5% ] 7.02% | 413 | 33.1% |
[ 7.5% - 8.0% ] 7.59% | 42,828 | 37.2% |
[ 8.5% - 9.0% ] 8.62% | 348 | 70.7% |
[ 9.0% - 9.5% ] 9.00% | 100 | 50.0% |
[ 9.0% - 9.5% ] 9.33% | 1,018 | 73.6% |
[ 9.5% - 10.0% ] 9.84% | 61 | 32.4% |
[ 9.5% - 10.0% ] 9.98% | 27,373 | 29.6% |
[ 10.5% - 11.0% ] 10.96% | 73 | 81.6% |
[ 11.0% - 11.5% ] 11.21% | 696 | 49.6% |
[ 12.0% - 12.5% ] 12.23% | 327 | 39.2% |
[ 15.0% - 15.5% ] 15.27% | 1,690 | 67.7% |
[ 16.0% - 16.5% ] 16.25% | 277 | 100.0% |
[ 28.5% - 29.0% ] 28.53% | 368 | 12.5% |
[ 31.5% - 32.0% ] 31.63% | 332 | 15.9% |
[ 34.0% - 34.5% ] 34.23% | 222 | 28.0% |
[ 37.5% - 38.0% ] 37.70% | 183 | 78.6% |
[ 43.0% - 43.5% ] 43.01% | 93 | 100.0% |
[ 52.5% - 53.0% ] 52.78% | 144 | 16.0% |