Immigrants from China 4 or more Vehicles in Household
COMPARE
Immigrants from China
Select to Compare
4 or more Vehicles in Household
Immigrants from China 4 or more Vehicles in Household
6.0%
4+ VEHICLES AVAILABLE
13.8/ 100
METRIC RATING
215th/ 347
METRIC RANK
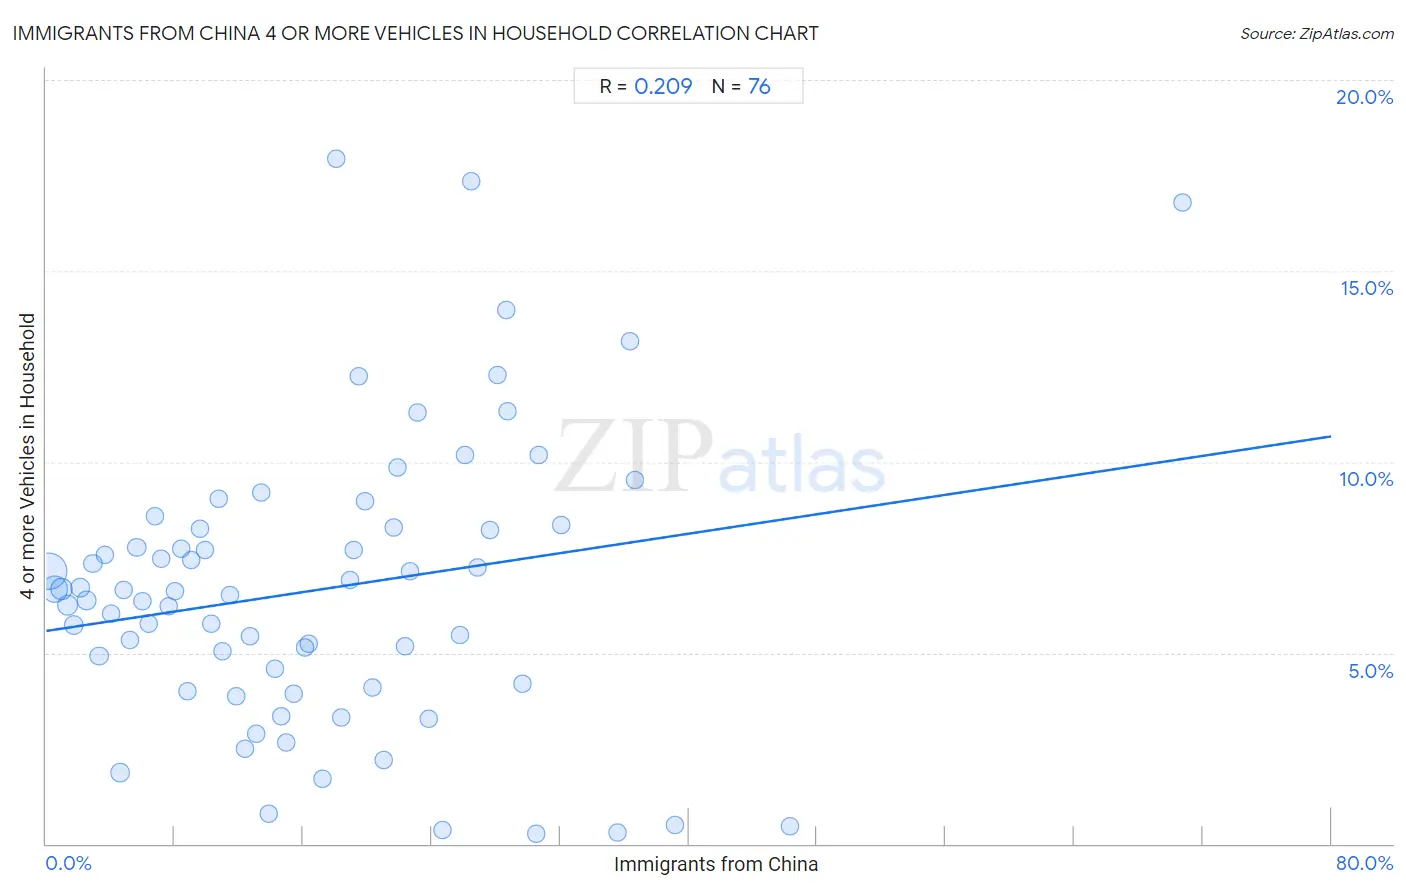
Immigrants from China 4 or more Vehicles in Household Correlation Chart
The statistical analysis conducted on geographies consisting of 454,562,757 people shows a weak positive correlation between the proportion of Immigrants from China and percentage of households with 4 or more vehicles available in the United States with a correlation coefficient (R) of 0.209 and weighted average of 6.0%. On average, for every 1% (one percent) increase in Immigrants from China within a typical geography, there is an increase of 0.064% in percentage of households with 4 or more vehicles available.
It is essential to understand that the correlation between the percentage of Immigrants from China and percentage of households with 4 or more vehicles available does not imply a direct cause-and-effect relationship. It remains uncertain whether the presence of Immigrants from China influences an upward or downward trend in the level of percentage of households with 4 or more vehicles available within an area, or if Immigrants from China simply ended up residing in those areas with higher or lower levels of percentage of households with 4 or more vehicles available due to other factors.
Demographics Similar to Immigrants from China by 4 or more Vehicles in Household
In terms of 4 or more vehicles in household, the demographic groups most similar to Immigrants from China are Immigrants from Romania (6.0%, a difference of 0.0%), Immigrants from Austria (6.0%, a difference of 0.11%), Arab (6.0%, a difference of 0.13%), Immigrants from Egypt (6.0%, a difference of 0.19%), and Panamanian (6.0%, a difference of 0.20%).
| Demographics | Rating | Rank | 4 or more Vehicles in Household |
| Immigrants from Nigeria | 15.6 /100 | #208 | Poor 6.1% |
| Immigrants from Honduras | 15.4 /100 | #209 | Poor 6.1% |
| Immigrants from Zimbabwe | 15.1 /100 | #210 | Poor 6.0% |
| Panamanians | 14.8 /100 | #211 | Poor 6.0% |
| Immigrants from Egypt | 14.7 /100 | #212 | Poor 6.0% |
| Arabs | 14.4 /100 | #213 | Poor 6.0% |
| Immigrants from Austria | 14.3 /100 | #214 | Poor 6.0% |
| Immigrants from China | 13.8 /100 | #215 | Poor 6.0% |
| Immigrants from Romania | 13.8 /100 | #216 | Poor 6.0% |
| Nigerians | 12.2 /100 | #217 | Poor 6.0% |
| Immigrants from Italy | 11.0 /100 | #218 | Poor 6.0% |
| Serbians | 11.0 /100 | #219 | Poor 6.0% |
| Russians | 10.3 /100 | #220 | Poor 6.0% |
| Immigrants from Moldova | 9.3 /100 | #221 | Tragic 6.0% |
| Cajuns | 9.2 /100 | #222 | Tragic 6.0% |
Immigrants from China 4 or more Vehicles in Household Correlation Summary
| Measurement | Immigrants from China Data | 4 or more Vehicles in Household Data |
| Minimum | 0.17% | 0.27% |
| Maximum | 70.7% | 17.9% |
| Range | 70.6% | 17.7% |
| Mean | 16.9% | 6.6% |
| Median | 14.8% | 6.6% |
| Interquartile 25% (IQ1) | 7.4% | 4.1% |
| Interquartile 75% (IQ3) | 24.2% | 8.3% |
| Interquartile Range (IQR) | 16.8% | 4.1% |
| Standard Deviation (Sample) | 12.4% | 3.8% |
| Standard Deviation (Population) | 12.3% | 3.8% |
Correlation Details
| Immigrants from China Percentile | Sample Size | 4 or more Vehicles in Household |
[ 0.0% - 0.5% ] 0.17% | 219,805,519 | 7.1% |
[ 0.5% - 1.0% ] 0.54% | 93,288,662 | 6.7% |
[ 0.5% - 1.0% ] 0.95% | 38,291,226 | 6.7% |
[ 1.0% - 1.5% ] 1.33% | 25,277,962 | 6.2% |
[ 1.5% - 2.0% ] 1.73% | 13,860,854 | 5.7% |
[ 2.0% - 2.5% ] 2.10% | 10,256,999 | 6.7% |
[ 2.5% - 3.0% ] 2.52% | 5,085,949 | 6.4% |
[ 2.5% - 3.0% ] 2.91% | 5,651,951 | 7.3% |
[ 3.0% - 3.5% ] 3.29% | 5,115,502 | 4.9% |
[ 3.5% - 4.0% ] 3.67% | 3,054,301 | 7.6% |
[ 4.0% - 4.5% ] 4.01% | 2,828,227 | 6.0% |
[ 4.5% - 5.0% ] 4.58% | 11,810,913 | 1.9% |
[ 4.5% - 5.0% ] 4.83% | 1,644,569 | 6.6% |
[ 5.0% - 5.5% ] 5.23% | 1,096,280 | 5.3% |
[ 5.5% - 6.0% ] 5.64% | 2,234,543 | 7.7% |
[ 6.0% - 6.5% ] 6.00% | 716,709 | 6.3% |
[ 6.0% - 6.5% ] 6.40% | 1,041,577 | 5.8% |
[ 6.5% - 7.0% ] 6.77% | 1,055,518 | 8.6% |
[ 7.0% - 7.5% ] 7.16% | 971,110 | 7.5% |
[ 7.5% - 8.0% ] 7.62% | 698,489 | 6.2% |
[ 7.5% - 8.0% ] 7.99% | 973,894 | 6.6% |
[ 8.0% - 8.5% ] 8.40% | 851,456 | 7.7% |
[ 8.5% - 9.0% ] 8.76% | 320,486 | 4.0% |
[ 9.0% - 9.5% ] 9.04% | 667,962 | 7.4% |
[ 9.5% - 10.0% ] 9.55% | 426,616 | 8.2% |
[ 9.5% - 10.0% ] 9.88% | 603,207 | 7.7% |
[ 10.0% - 10.5% ] 10.25% | 245,944 | 5.8% |
[ 10.5% - 11.0% ] 10.70% | 336,200 | 9.0% |
[ 10.5% - 11.0% ] 10.99% | 435,671 | 5.0% |
[ 11.0% - 11.5% ] 11.41% | 531,653 | 6.5% |
[ 11.5% - 12.0% ] 11.81% | 167,233 | 3.9% |
[ 12.0% - 12.5% ] 12.35% | 1,057,857 | 2.5% |
[ 12.5% - 13.0% ] 12.68% | 383,600 | 5.5% |
[ 13.0% - 13.5% ] 13.07% | 268,571 | 2.9% |
[ 13.0% - 13.5% ] 13.39% | 360,552 | 9.2% |
[ 13.5% - 14.0% ] 13.88% | 110,292 | 0.77% |
[ 14.0% - 14.5% ] 14.28% | 38,973 | 4.6% |
[ 14.5% - 15.0% ] 14.63% | 97,288 | 3.3% |
[ 14.5% - 15.0% ] 14.93% | 110,434 | 2.6% |
[ 15.0% - 15.5% ] 15.39% | 40,627 | 3.9% |
[ 16.0% - 16.5% ] 16.11% | 183,427 | 5.1% |
[ 16.0% - 16.5% ] 16.38% | 50,637 | 5.2% |
[ 17.0% - 17.5% ] 17.19% | 148,790 | 1.7% |
[ 18.0% - 18.5% ] 18.02% | 111,247 | 17.9% |
[ 18.0% - 18.5% ] 18.40% | 312,200 | 3.3% |
[ 18.5% - 19.0% ] 18.92% | 113,241 | 6.9% |
[ 19.0% - 19.5% ] 19.18% | 235,005 | 7.7% |
[ 19.0% - 19.5% ] 19.44% | 45,650 | 12.2% |
[ 19.5% - 20.0% ] 19.85% | 131,923 | 9.0% |
[ 20.0% - 20.5% ] 20.31% | 384 | 4.1% |
[ 20.5% - 21.0% ] 20.98% | 14,204 | 2.2% |
[ 21.5% - 22.0% ] 21.65% | 89,435 | 8.3% |
[ 21.5% - 22.0% ] 21.87% | 143,740 | 9.9% |
[ 22.0% - 22.5% ] 22.31% | 102,223 | 5.2% |
[ 22.5% - 23.0% ] 22.68% | 85,306 | 7.2% |
[ 23.0% - 23.5% ] 23.13% | 24,169 | 11.3% |
[ 23.5% - 24.0% ] 23.82% | 1,100 | 3.3% |
[ 24.5% - 25.0% ] 24.66% | 80,986 | 0.36% |
[ 25.5% - 26.0% ] 25.74% | 134,385 | 5.5% |
[ 26.0% - 26.5% ] 26.09% | 151,983 | 10.2% |
[ 26.0% - 26.5% ] 26.46% | 28,212 | 17.4% |
[ 26.5% - 27.0% ] 26.87% | 68,923 | 7.2% |
[ 27.5% - 28.0% ] 27.63% | 36,165 | 8.2% |
[ 28.0% - 28.5% ] 28.13% | 37,340 | 12.3% |
[ 28.5% - 29.0% ] 28.67% | 43,851 | 14.0% |
[ 28.5% - 29.0% ] 28.73% | 87,947 | 11.3% |
[ 29.5% - 30.0% ] 29.68% | 1,176 | 4.2% |
[ 30.5% - 31.0% ] 30.51% | 25,460 | 0.27% |
[ 30.5% - 31.0% ] 30.69% | 61,340 | 10.2% |
[ 32.0% - 32.5% ] 32.09% | 430 | 8.3% |
[ 35.5% - 36.0% ] 35.57% | 12,070 | 0.29% |
[ 36.0% - 36.5% ] 36.36% | 25,001 | 13.2% |
[ 36.5% - 37.0% ] 36.69% | 26,418 | 9.5% |
[ 39.0% - 39.5% ] 39.16% | 53,371 | 0.50% |
[ 46.0% - 46.5% ] 46.27% | 79,495 | 0.45% |
[ 70.5% - 71.0% ] 70.75% | 147 | 16.8% |