Immigrants from China 1 or more Vehicles in Household
COMPARE
Immigrants from China
Select to Compare
1 or more Vehicles in Household
Immigrants from China 1 or more Vehicles in Household
84.9%
1+ VEHICLES AVAILABLE
0.0/ 100
METRIC RATING
305th/ 347
METRIC RANK
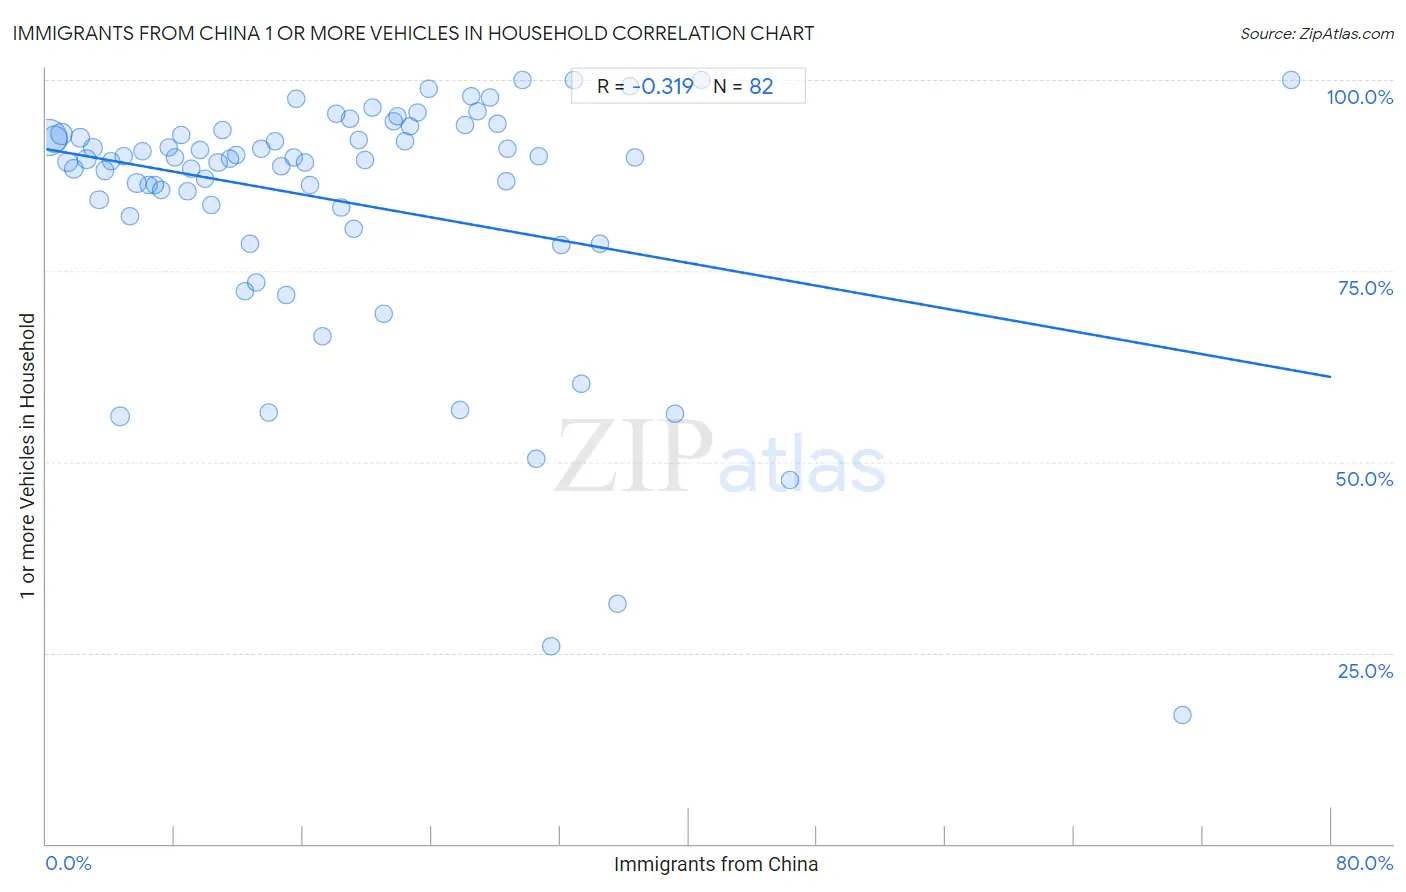
Immigrants from China 1 or more Vehicles in Household Correlation Chart
The statistical analysis conducted on geographies consisting of 456,603,328 people shows a mild negative correlation between the proportion of Immigrants from China and percentage of households with 1 or more vehicles available in the United States with a correlation coefficient (R) of -0.319 and weighted average of 84.9%. On average, for every 1% (one percent) increase in Immigrants from China within a typical geography, there is a decrease of 0.37% in percentage of households with 1 or more vehicles available.
It is essential to understand that the correlation between the percentage of Immigrants from China and percentage of households with 1 or more vehicles available does not imply a direct cause-and-effect relationship. It remains uncertain whether the presence of Immigrants from China influences an upward or downward trend in the level of percentage of households with 1 or more vehicles available within an area, or if Immigrants from China simply ended up residing in those areas with higher or lower levels of percentage of households with 1 or more vehicles available due to other factors.
Demographics Similar to Immigrants from China by 1 or more Vehicles in Household
In terms of 1 or more vehicles in household, the demographic groups most similar to Immigrants from China are Immigrants from Western Africa (84.9%, a difference of 0.020%), Tohono O'odham (84.7%, a difference of 0.28%), Immigrants from Belize (84.7%, a difference of 0.31%), Immigrants from Haiti (84.7%, a difference of 0.32%), and Immigrants from Ukraine (85.2%, a difference of 0.34%).
| Demographics | Rating | Rank | 1 or more Vehicles in Household |
| Belizeans | 0.0 /100 | #298 | Tragic 85.7% |
| Yuman | 0.0 /100 | #299 | Tragic 85.5% |
| Immigrants from Russia | 0.0 /100 | #300 | Tragic 85.4% |
| Immigrants from Panama | 0.0 /100 | #301 | Tragic 85.4% |
| Moroccans | 0.0 /100 | #302 | Tragic 85.4% |
| Immigrants from Greece | 0.0 /100 | #303 | Tragic 85.4% |
| Immigrants from Ukraine | 0.0 /100 | #304 | Tragic 85.2% |
| Immigrants from China | 0.0 /100 | #305 | Tragic 84.9% |
| Immigrants from Western Africa | 0.0 /100 | #306 | Tragic 84.9% |
| Tohono O'odham | 0.0 /100 | #307 | Tragic 84.7% |
| Immigrants from Belize | 0.0 /100 | #308 | Tragic 84.7% |
| Immigrants from Haiti | 0.0 /100 | #309 | Tragic 84.7% |
| U.S. Virgin Islanders | 0.0 /100 | #310 | Tragic 84.6% |
| Puerto Ricans | 0.0 /100 | #311 | Tragic 84.6% |
| Cape Verdeans | 0.0 /100 | #312 | Tragic 84.5% |
Immigrants from China 1 or more Vehicles in Household Correlation Summary
| Measurement | Immigrants from China Data | 1 or more Vehicles in Household Data |
| Minimum | 0.17% | 16.8% |
| Maximum | 77.5% | 100.0% |
| Range | 77.4% | 83.2% |
| Mean | 18.6% | 84.0% |
| Median | 15.9% | 89.7% |
| Interquartile 25% (IQ1) | 8.0% | 83.3% |
| Interquartile 75% (IQ3) | 26.9% | 92.9% |
| Interquartile Range (IQR) | 18.9% | 9.6% |
| Standard Deviation (Sample) | 14.3% | 16.7% |
| Standard Deviation (Population) | 14.2% | 16.6% |
Correlation Details
| Immigrants from China Percentile | Sample Size | 1 or more Vehicles in Household |
[ 0.0% - 0.5% ] 0.17% | 220,259,859 | 92.4% |
[ 0.5% - 1.0% ] 0.54% | 93,546,064 | 92.3% |
[ 0.5% - 1.0% ] 0.95% | 38,612,709 | 92.9% |
[ 1.0% - 1.5% ] 1.33% | 25,344,296 | 89.2% |
[ 1.5% - 2.0% ] 1.73% | 13,970,129 | 88.3% |
[ 2.0% - 2.5% ] 2.10% | 10,317,620 | 92.4% |
[ 2.5% - 3.0% ] 2.52% | 5,164,115 | 89.6% |
[ 2.5% - 3.0% ] 2.91% | 5,854,604 | 91.1% |
[ 3.0% - 3.5% ] 3.29% | 5,133,539 | 84.3% |
[ 3.5% - 4.0% ] 3.67% | 3,128,982 | 88.1% |
[ 4.0% - 4.5% ] 4.01% | 2,857,728 | 89.4% |
[ 4.5% - 5.0% ] 4.58% | 11,872,224 | 56.0% |
[ 4.5% - 5.0% ] 4.83% | 1,647,878 | 90.0% |
[ 5.0% - 5.5% ] 5.24% | 1,107,962 | 82.2% |
[ 5.5% - 6.0% ] 5.64% | 2,269,587 | 86.5% |
[ 6.0% - 6.5% ] 6.00% | 717,241 | 90.6% |
[ 6.0% - 6.5% ] 6.40% | 1,099,037 | 86.2% |
[ 6.5% - 7.0% ] 6.77% | 1,062,752 | 86.3% |
[ 7.0% - 7.5% ] 7.15% | 1,072,218 | 85.5% |
[ 7.5% - 8.0% ] 7.61% | 714,153 | 91.1% |
[ 7.5% - 8.0% ] 7.99% | 978,196 | 89.8% |
[ 8.0% - 8.5% ] 8.40% | 886,360 | 92.8% |
[ 8.5% - 9.0% ] 8.76% | 346,573 | 85.4% |
[ 9.0% - 9.5% ] 9.04% | 681,624 | 88.4% |
[ 9.5% - 10.0% ] 9.55% | 428,401 | 90.9% |
[ 9.5% - 10.0% ] 9.88% | 604,428 | 87.0% |
[ 10.0% - 10.5% ] 10.25% | 265,462 | 83.6% |
[ 10.5% - 11.0% ] 10.70% | 348,949 | 89.3% |
[ 10.5% - 11.0% ] 10.99% | 435,671 | 93.5% |
[ 11.0% - 11.5% ] 11.41% | 531,653 | 89.7% |
[ 11.5% - 12.0% ] 11.81% | 167,233 | 90.2% |
[ 12.0% - 12.5% ] 12.35% | 1,057,857 | 72.3% |
[ 12.5% - 13.0% ] 12.68% | 389,111 | 78.5% |
[ 13.0% - 13.5% ] 13.06% | 273,045 | 73.5% |
[ 13.0% - 13.5% ] 13.39% | 360,552 | 91.0% |
[ 13.5% - 14.0% ] 13.86% | 120,497 | 56.4% |
[ 14.0% - 14.5% ] 14.27% | 47,350 | 92.0% |
[ 14.5% - 15.0% ] 14.63% | 97,288 | 88.7% |
[ 14.5% - 15.0% ] 14.93% | 110,434 | 71.9% |
[ 15.0% - 15.5% ] 15.39% | 40,627 | 89.9% |
[ 15.5% - 16.0% ] 15.59% | 744 | 97.5% |
[ 16.0% - 16.5% ] 16.11% | 183,427 | 89.3% |
[ 16.0% - 16.5% ] 16.38% | 51,894 | 86.3% |
[ 17.0% - 17.5% ] 17.19% | 148,790 | 66.5% |
[ 18.0% - 18.5% ] 18.02% | 111,247 | 95.6% |
[ 18.0% - 18.5% ] 18.40% | 312,200 | 83.3% |
[ 18.5% - 19.0% ] 18.92% | 113,241 | 94.9% |
[ 19.0% - 19.5% ] 19.18% | 235,005 | 80.5% |
[ 19.0% - 19.5% ] 19.44% | 45,650 | 92.1% |
[ 19.5% - 20.0% ] 19.85% | 131,923 | 89.5% |
[ 20.0% - 20.5% ] 20.31% | 384 | 96.4% |
[ 20.5% - 21.0% ] 20.98% | 14,204 | 69.4% |
[ 21.5% - 22.0% ] 21.65% | 89,435 | 94.7% |
[ 21.5% - 22.0% ] 21.87% | 143,740 | 95.2% |
[ 22.0% - 22.5% ] 22.31% | 102,223 | 92.0% |
[ 22.5% - 23.0% ] 22.68% | 85,306 | 93.9% |
[ 23.0% - 23.5% ] 23.13% | 24,169 | 95.8% |
[ 23.5% - 24.0% ] 23.82% | 1,100 | 98.9% |
[ 25.5% - 26.0% ] 25.74% | 134,385 | 56.8% |
[ 26.0% - 26.5% ] 26.09% | 151,983 | 94.1% |
[ 26.0% - 26.5% ] 26.46% | 28,212 | 97.9% |
[ 26.5% - 27.0% ] 26.87% | 68,923 | 96.0% |
[ 27.5% - 28.0% ] 27.63% | 36,165 | 97.7% |
[ 28.0% - 28.5% ] 28.13% | 37,340 | 94.2% |
[ 28.5% - 29.0% ] 28.66% | 52,268 | 86.7% |
[ 28.5% - 29.0% ] 28.73% | 87,947 | 90.9% |
[ 29.5% - 30.0% ] 29.68% | 1,176 | 100.0% |
[ 30.5% - 31.0% ] 30.51% | 25,460 | 50.3% |
[ 30.5% - 31.0% ] 30.69% | 61,532 | 90.1% |
[ 31.0% - 31.5% ] 31.42% | 557 | 25.8% |
[ 32.0% - 32.5% ] 32.09% | 430 | 78.3% |
[ 32.5% - 33.0% ] 32.83% | 329 | 100.0% |
[ 33.0% - 33.5% ] 33.33% | 117 | 60.3% |
[ 34.5% - 35.0% ] 34.51% | 1,107 | 78.6% |
[ 35.5% - 36.0% ] 35.57% | 12,070 | 31.4% |
[ 36.0% - 36.5% ] 36.36% | 25,001 | 99.2% |
[ 36.5% - 37.0% ] 36.69% | 26,418 | 89.9% |
[ 39.0% - 39.5% ] 39.16% | 53,371 | 56.3% |
[ 40.5% - 41.0% ] 40.74% | 27 | 100.0% |
[ 46.0% - 46.5% ] 46.27% | 79,495 | 47.6% |
[ 70.5% - 71.0% ] 70.75% | 147 | 16.8% |
[ 77.5% - 78.0% ] 77.53% | 178 | 100.0% |