Immigrants from China GED/Equivalency
COMPARE
Immigrants from China
Select to Compare
GED/Equivalency
Immigrants from China GED/Equivalency
86.9%
GED/EQUIVALENCY
93.2/ 100
METRIC RATING
119th/ 347
METRIC RANK
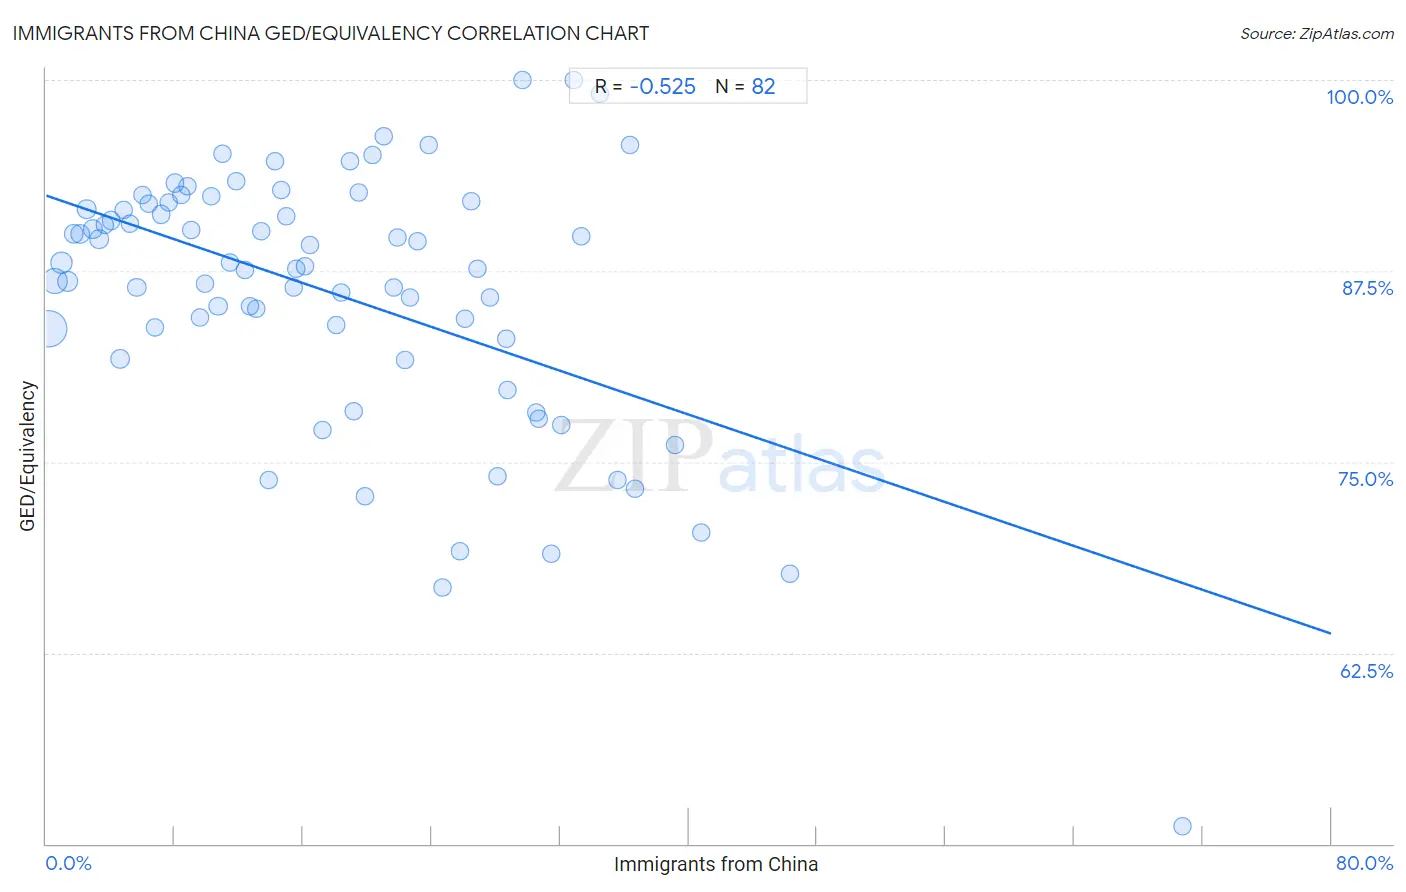
Immigrants from China GED/Equivalency Correlation Chart
The statistical analysis conducted on geographies consisting of 457,082,738 people shows a substantial negative correlation between the proportion of Immigrants from China and percentage of population with at least ged/equivalency education in the United States with a correlation coefficient (R) of -0.525 and weighted average of 86.9%. On average, for every 1% (one percent) increase in Immigrants from China within a typical geography, there is a decrease of 0.36% in percentage of population with at least ged/equivalency education.
It is essential to understand that the correlation between the percentage of Immigrants from China and percentage of population with at least ged/equivalency education does not imply a direct cause-and-effect relationship. It remains uncertain whether the presence of Immigrants from China influences an upward or downward trend in the level of percentage of population with at least ged/equivalency education within an area, or if Immigrants from China simply ended up residing in those areas with higher or lower levels of percentage of population with at least ged/equivalency education due to other factors.
Demographics Similar to Immigrants from China by GED/Equivalency
In terms of ged/equivalency, the demographic groups most similar to Immigrants from China are French Canadian (86.9%, a difference of 0.0%), Immigrants from Hong Kong (86.9%, a difference of 0.050%), Swiss (87.0%, a difference of 0.12%), Scotch-Irish (86.8%, a difference of 0.12%), and Immigrants from Kazakhstan (87.0%, a difference of 0.13%).
| Demographics | Rating | Rank | GED/Equivalency |
| Tlingit-Haida | 94.8 /100 | #112 | Exceptional 87.0% |
| Assyrians/Chaldeans/Syriacs | 94.8 /100 | #113 | Exceptional 87.0% |
| Immigrants from Kazakhstan | 94.7 /100 | #114 | Exceptional 87.0% |
| Mongolians | 94.6 /100 | #115 | Exceptional 87.0% |
| Swiss | 94.5 /100 | #116 | Exceptional 87.0% |
| Immigrants from Hong Kong | 93.8 /100 | #117 | Exceptional 86.9% |
| French Canadians | 93.2 /100 | #118 | Exceptional 86.9% |
| Immigrants from China | 93.2 /100 | #119 | Exceptional 86.9% |
| Scotch-Irish | 91.6 /100 | #120 | Exceptional 86.8% |
| Immigrants from Lebanon | 90.9 /100 | #121 | Exceptional 86.8% |
| Immigrants from Jordan | 90.8 /100 | #122 | Exceptional 86.8% |
| Immigrants from Italy | 90.5 /100 | #123 | Exceptional 86.7% |
| Immigrants from Egypt | 90.4 /100 | #124 | Exceptional 86.7% |
| Celtics | 90.4 /100 | #125 | Exceptional 86.7% |
| Asians | 90.3 /100 | #126 | Exceptional 86.7% |
Immigrants from China GED/Equivalency Correlation Summary
| Measurement | Immigrants from China Data | GED/Equivalency Data |
| Minimum | 0.17% | 51.2% |
| Maximum | 70.7% | 100.0% |
| Range | 70.6% | 48.8% |
| Mean | 17.9% | 86.0% |
| Median | 15.9% | 87.7% |
| Interquartile 25% (IQ1) | 8.0% | 83.1% |
| Interquartile 75% (IQ3) | 26.5% | 91.9% |
| Interquartile Range (IQR) | 18.5% | 8.8% |
| Standard Deviation (Sample) | 12.7% | 8.6% |
| Standard Deviation (Population) | 12.6% | 8.6% |
Correlation Details
| Immigrants from China Percentile | Sample Size | GED/Equivalency |
[ 0.0% - 0.5% ] 0.17% | 220,324,951 | 83.7% |
[ 0.5% - 1.0% ] 0.54% | 93,582,682 | 86.8% |
[ 0.5% - 1.0% ] 0.95% | 38,697,548 | 88.0% |
[ 1.0% - 1.5% ] 1.33% | 25,369,069 | 86.8% |
[ 1.5% - 2.0% ] 1.73% | 14,014,434 | 89.9% |
[ 2.0% - 2.5% ] 2.10% | 10,341,149 | 89.9% |
[ 2.5% - 3.0% ] 2.52% | 5,191,662 | 91.5% |
[ 2.5% - 3.0% ] 2.91% | 5,878,837 | 90.2% |
[ 3.0% - 3.5% ] 3.29% | 5,136,186 | 89.6% |
[ 3.5% - 4.0% ] 3.67% | 3,135,655 | 90.5% |
[ 4.0% - 4.5% ] 4.01% | 2,861,946 | 90.8% |
[ 4.5% - 5.0% ] 4.58% | 11,875,310 | 81.7% |
[ 4.5% - 5.0% ] 4.83% | 1,647,980 | 91.5% |
[ 5.0% - 5.5% ] 5.23% | 1,114,212 | 90.6% |
[ 5.5% - 6.0% ] 5.64% | 2,273,863 | 86.5% |
[ 6.0% - 6.5% ] 6.00% | 721,200 | 92.5% |
[ 6.0% - 6.5% ] 6.40% | 1,115,149 | 91.9% |
[ 6.5% - 7.0% ] 6.77% | 1,063,408 | 83.8% |
[ 7.0% - 7.5% ] 7.15% | 1,074,480 | 91.2% |
[ 7.5% - 8.0% ] 7.61% | 714,153 | 92.0% |
[ 7.5% - 8.0% ] 7.99% | 978,196 | 93.3% |
[ 8.0% - 8.5% ] 8.40% | 886,551 | 92.5% |
[ 8.5% - 9.0% ] 8.76% | 351,667 | 93.0% |
[ 9.0% - 9.5% ] 9.04% | 681,745 | 90.2% |
[ 9.5% - 10.0% ] 9.55% | 428,401 | 84.4% |
[ 9.5% - 10.0% ] 9.88% | 606,826 | 86.7% |
[ 10.0% - 10.5% ] 10.25% | 274,217 | 92.4% |
[ 10.5% - 11.0% ] 10.70% | 348,949 | 85.2% |
[ 10.5% - 11.0% ] 10.99% | 435,671 | 95.2% |
[ 11.0% - 11.5% ] 11.41% | 531,653 | 88.1% |
[ 11.5% - 12.0% ] 11.81% | 167,233 | 93.3% |
[ 12.0% - 12.5% ] 12.35% | 1,057,857 | 87.6% |
[ 12.5% - 13.0% ] 12.68% | 389,111 | 85.2% |
[ 13.0% - 13.5% ] 13.06% | 273,868 | 85.0% |
[ 13.0% - 13.5% ] 13.39% | 360,552 | 90.1% |
[ 13.5% - 14.0% ] 13.86% | 120,540 | 73.8% |
[ 14.0% - 14.5% ] 14.27% | 47,350 | 94.7% |
[ 14.5% - 15.0% ] 14.63% | 97,288 | 92.8% |
[ 14.5% - 15.0% ] 14.93% | 110,434 | 91.1% |
[ 15.0% - 15.5% ] 15.39% | 40,627 | 86.5% |
[ 15.5% - 16.0% ] 15.59% | 744 | 87.6% |
[ 16.0% - 16.5% ] 16.11% | 183,427 | 87.8% |
[ 16.0% - 16.5% ] 16.38% | 51,894 | 89.2% |
[ 17.0% - 17.5% ] 17.19% | 148,790 | 77.1% |
[ 18.0% - 18.5% ] 18.02% | 111,247 | 84.0% |
[ 18.0% - 18.5% ] 18.40% | 312,200 | 86.1% |
[ 18.5% - 19.0% ] 18.92% | 113,241 | 94.7% |
[ 19.0% - 19.5% ] 19.18% | 235,005 | 78.3% |
[ 19.0% - 19.5% ] 19.44% | 45,650 | 92.7% |
[ 19.5% - 20.0% ] 19.85% | 131,923 | 72.8% |
[ 20.0% - 20.5% ] 20.31% | 384 | 95.1% |
[ 20.5% - 21.0% ] 20.98% | 14,204 | 96.3% |
[ 21.5% - 22.0% ] 21.65% | 89,435 | 86.4% |
[ 21.5% - 22.0% ] 21.87% | 143,740 | 89.7% |
[ 22.0% - 22.5% ] 22.31% | 102,223 | 81.7% |
[ 22.5% - 23.0% ] 22.68% | 85,306 | 85.7% |
[ 23.0% - 23.5% ] 23.13% | 24,169 | 89.5% |
[ 23.5% - 24.0% ] 23.82% | 1,100 | 95.7% |
[ 24.5% - 25.0% ] 24.66% | 80,986 | 66.8% |
[ 25.5% - 26.0% ] 25.74% | 134,385 | 69.2% |
[ 26.0% - 26.5% ] 26.09% | 151,983 | 84.4% |
[ 26.0% - 26.5% ] 26.46% | 28,212 | 92.0% |
[ 26.5% - 27.0% ] 26.87% | 68,923 | 87.6% |
[ 27.5% - 28.0% ] 27.63% | 36,165 | 85.7% |
[ 28.0% - 28.5% ] 28.13% | 37,340 | 74.1% |
[ 28.5% - 29.0% ] 28.66% | 52,268 | 83.1% |
[ 28.5% - 29.0% ] 28.73% | 87,947 | 79.7% |
[ 29.5% - 30.0% ] 29.68% | 1,176 | 100.0% |
[ 30.5% - 31.0% ] 30.51% | 25,460 | 78.2% |
[ 30.5% - 31.0% ] 30.69% | 61,532 | 77.9% |
[ 31.0% - 31.5% ] 31.42% | 557 | 69.0% |
[ 32.0% - 32.5% ] 32.09% | 430 | 77.4% |
[ 32.5% - 33.0% ] 32.83% | 329 | 100.0% |
[ 33.0% - 33.5% ] 33.33% | 117 | 89.8% |
[ 34.5% - 35.0% ] 34.51% | 1,107 | 99.1% |
[ 35.5% - 36.0% ] 35.57% | 12,070 | 73.8% |
[ 36.0% - 36.5% ] 36.36% | 25,001 | 95.7% |
[ 36.5% - 37.0% ] 36.69% | 26,418 | 73.3% |
[ 39.0% - 39.5% ] 39.16% | 53,371 | 76.1% |
[ 40.5% - 41.0% ] 40.74% | 27 | 70.4% |
[ 46.0% - 46.5% ] 46.27% | 79,495 | 67.7% |
[ 70.5% - 71.0% ] 70.75% | 147 | 51.2% |