Immigrants from China Married-couple Households
COMPARE
Immigrants from China
Select to Compare
Married-couple Households
Immigrants from China Married-couple Households
48.4%
MARRIED-COUPLE HOUSEHOLDS
98.9/ 100
METRIC RATING
69th/ 347
METRIC RANK
Immigrants from China Married-couple Households Correlation Chart
The statistical analysis conducted on geographies consisting of 456,566,781 people shows no correlation between the proportion of Immigrants from China and percentage of married-couple family households in the United States with a correlation coefficient (R) of -0.041 and weighted average of 48.4%. On average, for every 1% (one percent) increase in Immigrants from China within a typical geography, there is a decrease of 0.032% in percentage of married-couple family households.
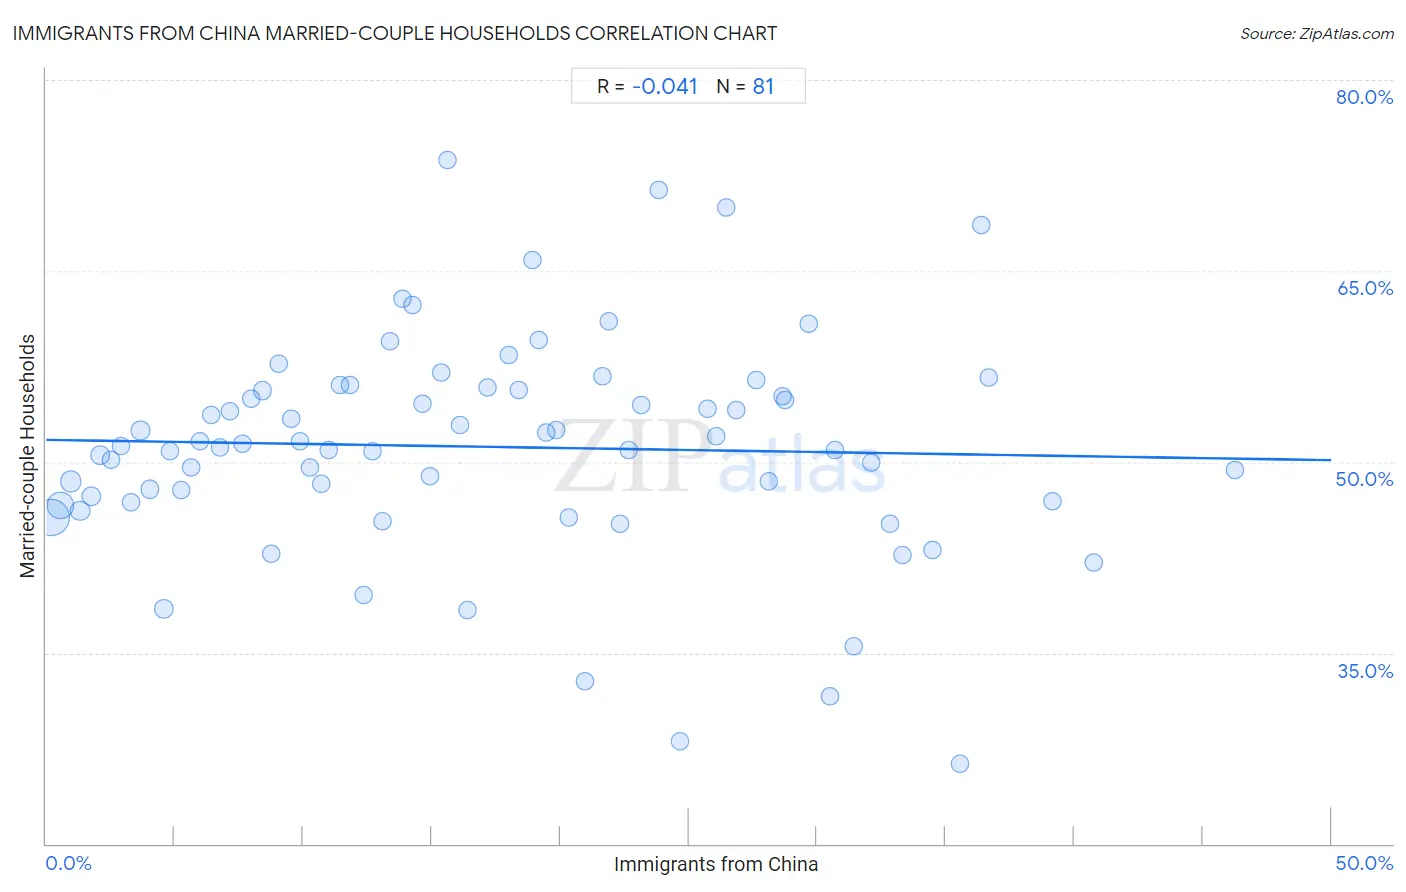
It is essential to understand that the correlation between the percentage of Immigrants from China and percentage of married-couple family households does not imply a direct cause-and-effect relationship. It remains uncertain whether the presence of Immigrants from China influences an upward or downward trend in the level of percentage of married-couple family households within an area, or if Immigrants from China simply ended up residing in those areas with higher or lower levels of percentage of married-couple family households due to other factors.
Demographics Similar to Immigrants from China by Married-couple Households
In terms of married-couple households, the demographic groups most similar to Immigrants from China are Immigrants from South Eastern Asia (48.4%, a difference of 0.0%), Romanian (48.4%, a difference of 0.010%), Jordanian (48.4%, a difference of 0.020%), Immigrants from Canada (48.4%, a difference of 0.040%), and Immigrants from North America (48.4%, a difference of 0.040%).
| Demographics | Rating | Rank | Married-couple Households |
| Luxembourgers | 99.1 /100 | #62 | Exceptional 48.5% |
| Basques | 99.0 /100 | #63 | Exceptional 48.4% |
| Northern Europeans | 99.0 /100 | #64 | Exceptional 48.4% |
| Immigrants from Canada | 99.0 /100 | #65 | Exceptional 48.4% |
| Jordanians | 98.9 /100 | #66 | Exceptional 48.4% |
| Romanians | 98.9 /100 | #67 | Exceptional 48.4% |
| Immigrants from South Eastern Asia | 98.9 /100 | #68 | Exceptional 48.4% |
| Immigrants from China | 98.9 /100 | #69 | Exceptional 48.4% |
| Immigrants from North America | 98.9 /100 | #70 | Exceptional 48.4% |
| Laotians | 98.8 /100 | #71 | Exceptional 48.4% |
| Scotch-Irish | 98.6 /100 | #72 | Exceptional 48.3% |
| Immigrants from Singapore | 98.6 /100 | #73 | Exceptional 48.3% |
| Immigrants from Romania | 98.6 /100 | #74 | Exceptional 48.3% |
| Immigrants from England | 98.4 /100 | #75 | Exceptional 48.2% |
| Immigrants from Fiji | 98.4 /100 | #76 | Exceptional 48.2% |
Immigrants from China Married-couple Households Correlation Summary
| Measurement | Immigrants from China Data | Married-couple Households Data |
| Minimum | 0.17% | 26.3% |
| Maximum | 46.3% | 73.8% |
| Range | 46.1% | 47.4% |
| Mean | 17.3% | 51.2% |
| Median | 15.6% | 51.3% |
| Interquartile 25% (IQ1) | 7.8% | 46.9% |
| Interquartile 75% (IQ3) | 26.3% | 55.7% |
| Interquartile Range (IQR) | 18.5% | 8.8% |
| Standard Deviation (Sample) | 11.3% | 8.7% |
| Standard Deviation (Population) | 11.2% | 8.6% |
Correlation Details
| Immigrants from China Percentile | Sample Size | Married-couple Households |
[ 0.0% - 0.5% ] 0.17% | 220,229,375 | 45.7% |
[ 0.5% - 1.0% ] 0.54% | 93,530,875 | 46.6% |
[ 0.5% - 1.0% ] 0.95% | 38,590,061 | 48.5% |
[ 1.0% - 1.5% ] 1.33% | 25,340,466 | 46.1% |
[ 1.5% - 2.0% ] 1.73% | 13,951,012 | 47.3% |
[ 2.0% - 2.5% ] 2.10% | 10,306,862 | 50.5% |
[ 2.5% - 3.0% ] 2.52% | 5,161,155 | 50.1% |
[ 2.5% - 3.0% ] 2.91% | 5,852,626 | 51.3% |
[ 3.0% - 3.5% ] 3.29% | 5,132,543 | 46.8% |
[ 3.5% - 4.0% ] 3.67% | 3,128,982 | 52.5% |
[ 4.0% - 4.5% ] 4.01% | 2,857,086 | 47.9% |
[ 4.5% - 5.0% ] 4.58% | 11,872,002 | 38.5% |
[ 4.5% - 5.0% ] 4.83% | 1,647,878 | 50.8% |
[ 5.0% - 5.5% ] 5.24% | 1,107,962 | 47.8% |
[ 5.5% - 6.0% ] 5.64% | 2,269,587 | 49.6% |
[ 6.0% - 6.5% ] 6.00% | 717,241 | 51.6% |
[ 6.0% - 6.5% ] 6.40% | 1,099,037 | 53.7% |
[ 6.5% - 7.0% ] 6.77% | 1,062,752 | 51.2% |
[ 7.0% - 7.5% ] 7.15% | 1,072,218 | 53.9% |
[ 7.5% - 8.0% ] 7.62% | 705,769 | 51.4% |
[ 7.5% - 8.0% ] 7.99% | 978,196 | 55.0% |
[ 8.0% - 8.5% ] 8.40% | 886,360 | 55.6% |
[ 8.5% - 9.0% ] 8.76% | 346,573 | 42.8% |
[ 9.0% - 9.5% ] 9.04% | 681,624 | 57.8% |
[ 9.5% - 10.0% ] 9.55% | 428,401 | 53.4% |
[ 9.5% - 10.0% ] 9.88% | 604,428 | 51.7% |
[ 10.0% - 10.5% ] 10.25% | 265,462 | 49.6% |
[ 10.5% - 11.0% ] 10.70% | 348,949 | 48.2% |
[ 10.5% - 11.0% ] 10.99% | 435,671 | 50.9% |
[ 11.0% - 11.5% ] 11.41% | 531,653 | 56.0% |
[ 11.5% - 12.0% ] 11.81% | 167,233 | 56.1% |
[ 12.0% - 12.5% ] 12.35% | 1,057,857 | 39.6% |
[ 12.5% - 13.0% ] 12.68% | 389,111 | 50.9% |
[ 13.0% - 13.5% ] 13.06% | 273,045 | 45.4% |
[ 13.0% - 13.5% ] 13.39% | 360,552 | 59.5% |
[ 13.5% - 14.0% ] 13.86% | 120,497 | 62.9% |
[ 14.0% - 14.5% ] 14.27% | 47,350 | 62.3% |
[ 14.5% - 15.0% ] 14.63% | 97,288 | 54.5% |
[ 14.5% - 15.0% ] 14.93% | 110,434 | 48.8% |
[ 15.0% - 15.5% ] 15.39% | 40,627 | 57.1% |
[ 15.5% - 16.0% ] 15.59% | 744 | 73.8% |
[ 16.0% - 16.5% ] 16.11% | 183,427 | 52.9% |
[ 16.0% - 16.5% ] 16.38% | 51,894 | 38.4% |
[ 17.0% - 17.5% ] 17.19% | 148,790 | 55.8% |
[ 18.0% - 18.5% ] 18.02% | 111,247 | 58.4% |
[ 18.0% - 18.5% ] 18.40% | 312,200 | 55.7% |
[ 18.5% - 19.0% ] 18.92% | 113,241 | 65.8% |
[ 19.0% - 19.5% ] 19.18% | 235,005 | 59.5% |
[ 19.0% - 19.5% ] 19.44% | 45,650 | 52.3% |
[ 19.5% - 20.0% ] 19.85% | 131,923 | 52.5% |
[ 20.0% - 20.5% ] 20.31% | 384 | 45.6% |
[ 20.5% - 21.0% ] 20.98% | 14,204 | 32.8% |
[ 21.5% - 22.0% ] 21.65% | 89,435 | 56.7% |
[ 21.5% - 22.0% ] 21.87% | 143,740 | 61.0% |
[ 22.0% - 22.5% ] 22.31% | 102,223 | 45.1% |
[ 22.5% - 23.0% ] 22.68% | 85,306 | 51.0% |
[ 23.0% - 23.5% ] 23.13% | 24,169 | 54.5% |
[ 23.5% - 24.0% ] 23.82% | 1,100 | 71.4% |
[ 24.5% - 25.0% ] 24.66% | 80,986 | 28.1% |
[ 25.5% - 26.0% ] 25.74% | 134,385 | 54.1% |
[ 26.0% - 26.5% ] 26.09% | 151,983 | 52.0% |
[ 26.0% - 26.5% ] 26.46% | 28,212 | 70.0% |
[ 26.5% - 27.0% ] 26.87% | 68,923 | 54.1% |
[ 27.5% - 28.0% ] 27.63% | 36,165 | 56.5% |
[ 28.0% - 28.5% ] 28.13% | 37,340 | 48.4% |
[ 28.5% - 29.0% ] 28.66% | 52,268 | 55.1% |
[ 28.5% - 29.0% ] 28.73% | 87,947 | 54.9% |
[ 29.5% - 30.0% ] 29.68% | 1,176 | 60.8% |
[ 30.5% - 31.0% ] 30.51% | 25,460 | 31.6% |
[ 30.5% - 31.0% ] 30.69% | 61,532 | 51.0% |
[ 31.0% - 31.5% ] 31.42% | 557 | 35.5% |
[ 32.0% - 32.5% ] 32.09% | 430 | 50.0% |
[ 32.5% - 33.0% ] 32.83% | 329 | 45.1% |
[ 33.0% - 33.5% ] 33.33% | 117 | 42.6% |
[ 34.5% - 35.0% ] 34.51% | 1,107 | 43.1% |
[ 35.5% - 36.0% ] 35.57% | 12,070 | 26.3% |
[ 36.0% - 36.5% ] 36.36% | 25,001 | 68.6% |
[ 36.5% - 37.0% ] 36.69% | 26,418 | 56.6% |
[ 39.0% - 39.5% ] 39.16% | 53,371 | 46.9% |
[ 40.5% - 41.0% ] 40.74% | 27 | 42.1% |
[ 46.0% - 46.5% ] 46.27% | 79,495 | 49.4% |