Immigrants from China Disability Age Under 5
COMPARE
Immigrants from China
Select to Compare
Disability Age Under 5
Immigrants from China Disability Age Under 5
0.96%
DISABILITY | AGE UNDER 5
100.0/ 100
METRIC RATING
17th/ 347
METRIC RANK
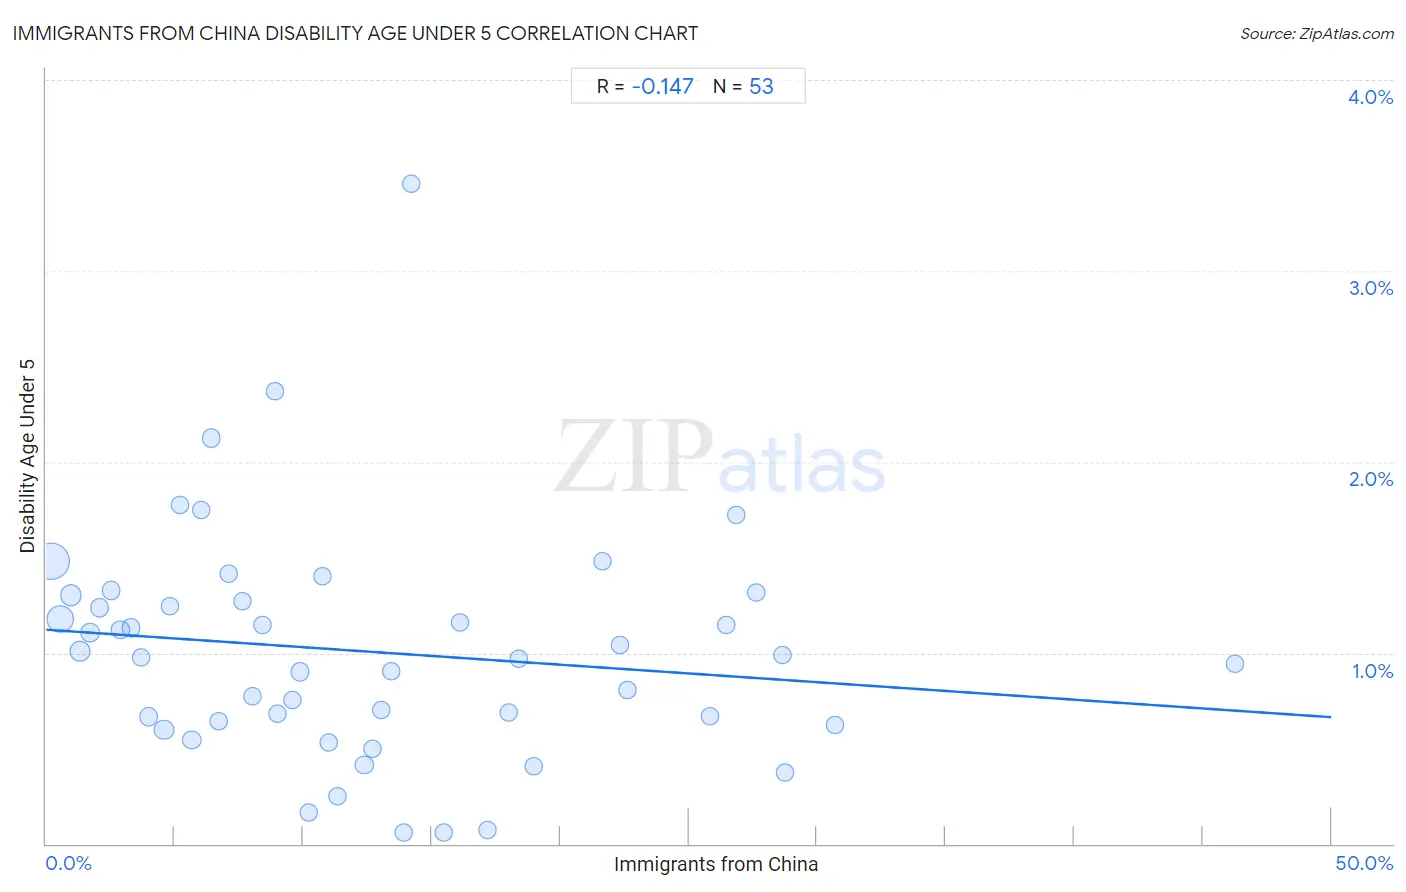
Immigrants from China Disability Age Under 5 Correlation Chart
The statistical analysis conducted on geographies consisting of 235,609,500 people shows a poor negative correlation between the proportion of Immigrants from China and percentage of population with a disability under the age of 5 in the United States with a correlation coefficient (R) of -0.147 and weighted average of 0.96%. On average, for every 1% (one percent) increase in Immigrants from China within a typical geography, there is a decrease of 0.0092% in percentage of population with a disability under the age of 5.
It is essential to understand that the correlation between the percentage of Immigrants from China and percentage of population with a disability under the age of 5 does not imply a direct cause-and-effect relationship. It remains uncertain whether the presence of Immigrants from China influences an upward or downward trend in the level of percentage of population with a disability under the age of 5 within an area, or if Immigrants from China simply ended up residing in those areas with higher or lower levels of percentage of population with a disability under the age of 5 due to other factors.
Demographics Similar to Immigrants from China by Disability Age Under 5
In terms of disability age under 5, the demographic groups most similar to Immigrants from China are Immigrants from Israel (0.96%, a difference of 0.41%), Immigrants from Barbados (0.97%, a difference of 0.58%), Puget Sound Salish (0.97%, a difference of 0.95%), Nepalese (0.97%, a difference of 1.1%), and Immigrants from Hong Kong (0.95%, a difference of 1.7%).
| Demographics | Rating | Rank | Disability Age Under 5 |
| Marshallese | 100.0 /100 | #10 | Exceptional 0.94% |
| Afghans | 100.0 /100 | #11 | Exceptional 0.94% |
| Immigrants from Grenada | 100.0 /100 | #12 | Exceptional 0.94% |
| Soviet Union | 100.0 /100 | #13 | Exceptional 0.95% |
| Yuman | 100.0 /100 | #14 | Exceptional 0.95% |
| Immigrants from Hong Kong | 100.0 /100 | #15 | Exceptional 0.95% |
| Immigrants from Israel | 100.0 /100 | #16 | Exceptional 0.96% |
| Immigrants from China | 100.0 /100 | #17 | Exceptional 0.96% |
| Immigrants from Barbados | 100.0 /100 | #18 | Exceptional 0.97% |
| Puget Sound Salish | 100.0 /100 | #19 | Exceptional 0.97% |
| Nepalese | 100.0 /100 | #20 | Exceptional 0.97% |
| British West Indians | 100.0 /100 | #21 | Exceptional 0.99% |
| Immigrants from Iran | 100.0 /100 | #22 | Exceptional 1.00% |
| Yakama | 100.0 /100 | #23 | Exceptional 1.00% |
| Indians (Asian) | 100.0 /100 | #24 | Exceptional 1.0% |
Immigrants from China Disability Age Under 5 Correlation Summary
| Measurement | Immigrants from China Data | Disability Age Under 5 Data |
| Minimum | 0.18% | 0.058% |
| Maximum | 46.3% | 3.5% |
| Range | 46.1% | 3.4% |
| Mean | 12.6% | 1.0% |
| Median | 10.2% | 0.97% |
| Interquartile 25% (IQ1) | 5.0% | 0.63% |
| Interquartile 75% (IQ3) | 18.2% | 1.3% |
| Interquartile Range (IQR) | 13.2% | 0.65% |
| Standard Deviation (Sample) | 9.7% | 0.61% |
| Standard Deviation (Population) | 9.6% | 0.60% |
Correlation Details
| Immigrants from China Percentile | Sample Size | Disability Age Under 5 |
[ 0.0% - 0.5% ] 0.18% | 111,015,738 | 1.5% |
[ 0.5% - 1.0% ] 0.54% | 48,781,808 | 1.2% |
[ 0.5% - 1.0% ] 0.95% | 18,911,981 | 1.3% |
[ 1.0% - 1.5% ] 1.32% | 14,747,531 | 1.0% |
[ 1.5% - 2.0% ] 1.71% | 6,468,141 | 1.1% |
[ 2.0% - 2.5% ] 2.08% | 4,834,892 | 1.2% |
[ 2.5% - 3.0% ] 2.54% | 1,868,273 | 1.3% |
[ 2.5% - 3.0% ] 2.89% | 2,666,114 | 1.1% |
[ 3.0% - 3.5% ] 3.29% | 3,133,707 | 1.1% |
[ 3.5% - 4.0% ] 3.68% | 1,304,983 | 0.97% |
[ 3.5% - 4.0% ] 3.99% | 1,563,769 | 0.67% |
[ 4.5% - 5.0% ] 4.59% | 10,583,742 | 0.60% |
[ 4.5% - 5.0% ] 4.82% | 755,712 | 1.2% |
[ 5.0% - 5.5% ] 5.20% | 471,475 | 1.8% |
[ 5.5% - 6.0% ] 5.66% | 1,602,780 | 0.55% |
[ 6.0% - 6.5% ] 6.02% | 359,192 | 1.7% |
[ 6.0% - 6.5% ] 6.40% | 301,955 | 2.1% |
[ 6.5% - 7.0% ] 6.73% | 83,599 | 0.64% |
[ 7.0% - 7.5% ] 7.12% | 375,695 | 1.4% |
[ 7.5% - 8.0% ] 7.64% | 443,966 | 1.3% |
[ 8.0% - 8.5% ] 8.03% | 355,911 | 0.77% |
[ 8.0% - 8.5% ] 8.42% | 330,665 | 1.1% |
[ 8.5% - 9.0% ] 8.90% | 26,946 | 2.4% |
[ 8.5% - 9.0% ] 8.99% | 316,939 | 0.68% |
[ 9.5% - 10.0% ] 9.56% | 261,942 | 0.75% |
[ 9.5% - 10.0% ] 9.87% | 414,622 | 0.90% |
[ 10.0% - 10.5% ] 10.22% | 150,606 | 0.16% |
[ 10.5% - 11.0% ] 10.75% | 65,799 | 1.4% |
[ 10.5% - 11.0% ] 10.99% | 417,349 | 0.53% |
[ 11.0% - 11.5% ] 11.34% | 296,696 | 0.25% |
[ 12.0% - 12.5% ] 12.37% | 938,207 | 0.41% |
[ 12.5% - 13.0% ] 12.70% | 257,191 | 0.50% |
[ 13.0% - 13.5% ] 13.04% | 140,612 | 0.70% |
[ 13.0% - 13.5% ] 13.40% | 70,305 | 0.90% |
[ 13.5% - 14.0% ] 13.89% | 92,283 | 0.058% |
[ 14.0% - 14.5% ] 14.19% | 14,281 | 3.5% |
[ 15.0% - 15.5% ] 15.46% | 29,544 | 0.058% |
[ 16.0% - 16.5% ] 16.12% | 96,800 | 1.2% |
[ 17.0% - 17.5% ] 17.18% | 80,575 | 0.069% |
[ 18.0% - 18.5% ] 18.02% | 110,950 | 0.69% |
[ 18.0% - 18.5% ] 18.39% | 227,805 | 0.97% |
[ 18.5% - 19.0% ] 18.95% | 59,763 | 0.40% |
[ 21.5% - 22.0% ] 21.67% | 29,006 | 1.5% |
[ 22.0% - 22.5% ] 22.31% | 82,295 | 1.0% |
[ 22.5% - 23.0% ] 22.64% | 53,320 | 0.80% |
[ 25.5% - 26.0% ] 25.81% | 41,377 | 0.67% |
[ 26.0% - 26.5% ] 26.46% | 28,212 | 1.1% |
[ 26.5% - 27.0% ] 26.87% | 68,923 | 1.7% |
[ 27.5% - 28.0% ] 27.63% | 36,165 | 1.3% |
[ 28.5% - 29.0% ] 28.66% | 52,268 | 0.99% |
[ 28.5% - 29.0% ] 28.75% | 47,209 | 0.37% |
[ 30.5% - 31.0% ] 30.69% | 60,386 | 0.62% |
[ 46.0% - 46.5% ] 46.27% | 79,495 | 0.94% |