Immigrants from China Wage/Income Gap
COMPARE
Immigrants from China
Select to Compare
Wage/Income Gap
Immigrants from China Wage/Income Gap
26.7%
WAGE/INCOME GAP
10.3/ 100
METRIC RATING
214th/ 347
METRIC RANK
Immigrants from China Wage/Income Gap Correlation Chart
The statistical analysis conducted on geographies consisting of 456,702,733 people shows a weak negative correlation between the proportion of Immigrants from China and wage/income gap percentage in the United States with a correlation coefficient (R) of -0.261 and weighted average of 26.7%. On average, for every 1% (one percent) increase in Immigrants from China within a typical geography, there is a decrease of 0.21% in wage/income gap percentage.
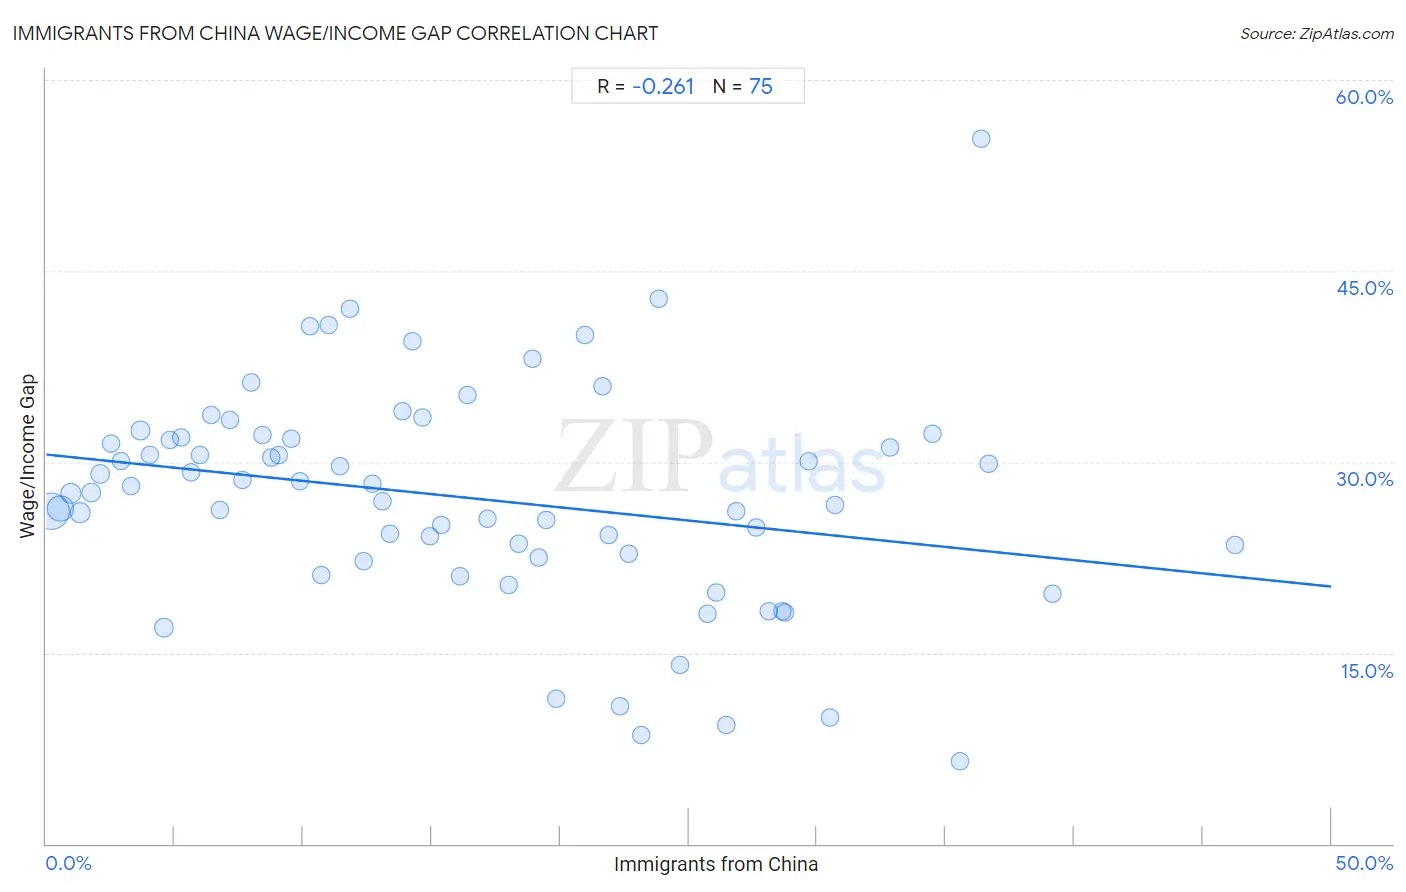
It is essential to understand that the correlation between the percentage of Immigrants from China and wage/income gap percentage does not imply a direct cause-and-effect relationship. It remains uncertain whether the presence of Immigrants from China influences an upward or downward trend in the level of wage/income gap percentage within an area, or if Immigrants from China simply ended up residing in those areas with higher or lower levels of wage/income gap percentage due to other factors.
Demographics Similar to Immigrants from China by Wage/Income Gap
In terms of wage/income gap, the demographic groups most similar to Immigrants from China are Immigrants from Iraq (26.7%, a difference of 0.010%), Yugoslavian (26.7%, a difference of 0.090%), Immigrants from Portugal (26.7%, a difference of 0.13%), Iraqi (26.6%, a difference of 0.16%), and Mongolian (26.6%, a difference of 0.19%).
| Demographics | Rating | Rank | Wage/Income Gap |
| Immigrants from Italy | 15.8 /100 | #207 | Poor 26.5% |
| Egyptians | 12.7 /100 | #208 | Poor 26.6% |
| Immigrants from Kuwait | 12.6 /100 | #209 | Poor 26.6% |
| Arabs | 12.3 /100 | #210 | Poor 26.6% |
| Mongolians | 11.4 /100 | #211 | Poor 26.6% |
| Iraqis | 11.2 /100 | #212 | Poor 26.6% |
| Immigrants from Iraq | 10.3 /100 | #213 | Poor 26.7% |
| Immigrants from China | 10.3 /100 | #214 | Poor 26.7% |
| Yugoslavians | 9.7 /100 | #215 | Tragic 26.7% |
| Immigrants from Portugal | 9.5 /100 | #216 | Tragic 26.7% |
| Brazilians | 9.2 /100 | #217 | Tragic 26.7% |
| Immigrants from Saudi Arabia | 9.1 /100 | #218 | Tragic 26.7% |
| Immigrants from Poland | 8.9 /100 | #219 | Tragic 26.7% |
| Immigrants from Latvia | 8.9 /100 | #220 | Tragic 26.7% |
| Immigrants from Spain | 8.5 /100 | #221 | Tragic 26.8% |
Immigrants from China Wage/Income Gap Correlation Summary
| Measurement | Immigrants from China Data | Wage/Income Gap Data |
| Minimum | 0.17% | 6.5% |
| Maximum | 46.3% | 55.3% |
| Range | 46.1% | 48.9% |
| Mean | 16.3% | 27.2% |
| Median | 14.6% | 27.6% |
| Interquartile 25% (IQ1) | 7.2% | 22.4% |
| Interquartile 75% (IQ3) | 24.7% | 31.9% |
| Interquartile Range (IQR) | 17.5% | 9.5% |
| Standard Deviation (Sample) | 11.0% | 8.7% |
| Standard Deviation (Population) | 10.9% | 8.6% |
Correlation Details
| Immigrants from China Percentile | Sample Size | Wage/Income Gap |
[ 0.0% - 0.5% ] 0.17% | 220,186,438 | 26.1% |
[ 0.5% - 1.0% ] 0.54% | 93,530,463 | 26.4% |
[ 0.5% - 1.0% ] 0.95% | 38,650,624 | 27.5% |
[ 1.0% - 1.5% ] 1.33% | 25,334,468 | 26.0% |
[ 1.5% - 2.0% ] 1.73% | 14,002,413 | 27.6% |
[ 2.0% - 2.5% ] 2.10% | 10,324,572 | 29.1% |
[ 2.5% - 3.0% ] 2.52% | 5,171,245 | 31.4% |
[ 2.5% - 3.0% ] 2.91% | 5,871,322 | 30.1% |
[ 3.0% - 3.5% ] 3.29% | 5,124,638 | 28.1% |
[ 3.5% - 4.0% ] 3.67% | 3,131,587 | 32.5% |
[ 4.0% - 4.5% ] 4.01% | 2,859,900 | 30.5% |
[ 4.5% - 5.0% ] 4.58% | 11,871,778 | 17.0% |
[ 4.5% - 5.0% ] 4.83% | 1,644,645 | 31.7% |
[ 5.0% - 5.5% ] 5.23% | 1,112,845 | 31.9% |
[ 5.5% - 6.0% ] 5.64% | 2,269,389 | 29.2% |
[ 6.0% - 6.5% ] 6.00% | 719,562 | 30.6% |
[ 6.0% - 6.5% ] 6.40% | 1,113,561 | 33.7% |
[ 6.5% - 7.0% ] 6.77% | 1,061,680 | 26.2% |
[ 7.0% - 7.5% ] 7.15% | 1,070,848 | 33.3% |
[ 7.5% - 8.0% ] 7.61% | 712,691 | 28.6% |
[ 7.5% - 8.0% ] 7.99% | 973,465 | 36.2% |
[ 8.0% - 8.5% ] 8.40% | 886,088 | 32.1% |
[ 8.5% - 9.0% ] 8.76% | 351,164 | 30.3% |
[ 9.0% - 9.5% ] 9.04% | 681,659 | 30.6% |
[ 9.5% - 10.0% ] 9.55% | 430,948 | 31.8% |
[ 9.5% - 10.0% ] 9.88% | 606,826 | 28.5% |
[ 10.0% - 10.5% ] 10.25% | 274,217 | 40.7% |
[ 10.5% - 11.0% ] 10.70% | 346,827 | 21.1% |
[ 10.5% - 11.0% ] 10.99% | 435,671 | 40.8% |
[ 11.0% - 11.5% ] 11.41% | 531,320 | 29.6% |
[ 11.5% - 12.0% ] 11.81% | 167,686 | 42.0% |
[ 12.0% - 12.5% ] 12.35% | 1,056,987 | 22.2% |
[ 12.5% - 13.0% ] 12.68% | 388,969 | 28.3% |
[ 13.0% - 13.5% ] 13.06% | 273,868 | 26.9% |
[ 13.0% - 13.5% ] 13.39% | 360,552 | 24.4% |
[ 13.5% - 14.0% ] 13.86% | 120,353 | 34.0% |
[ 14.0% - 14.5% ] 14.27% | 47,202 | 39.5% |
[ 14.5% - 15.0% ] 14.63% | 97,288 | 33.4% |
[ 14.5% - 15.0% ] 14.93% | 110,434 | 24.2% |
[ 15.0% - 15.5% ] 15.39% | 40,627 | 25.1% |
[ 16.0% - 16.5% ] 16.11% | 183,427 | 21.1% |
[ 16.0% - 16.5% ] 16.38% | 50,637 | 35.2% |
[ 17.0% - 17.5% ] 17.19% | 148,790 | 25.6% |
[ 18.0% - 18.5% ] 18.02% | 111,247 | 20.4% |
[ 18.0% - 18.5% ] 18.40% | 312,200 | 23.5% |
[ 18.5% - 19.0% ] 18.92% | 113,241 | 38.1% |
[ 19.0% - 19.5% ] 19.18% | 235,005 | 22.4% |
[ 19.0% - 19.5% ] 19.44% | 45,650 | 25.5% |
[ 19.5% - 20.0% ] 19.85% | 131,923 | 11.4% |
[ 20.5% - 21.0% ] 20.98% | 14,204 | 39.9% |
[ 21.5% - 22.0% ] 21.65% | 89,075 | 35.9% |
[ 21.5% - 22.0% ] 21.87% | 143,740 | 24.3% |
[ 22.0% - 22.5% ] 22.31% | 102,223 | 10.8% |
[ 22.5% - 23.0% ] 22.68% | 85,306 | 22.8% |
[ 23.0% - 23.5% ] 23.13% | 24,169 | 8.6% |
[ 23.5% - 24.0% ] 23.82% | 1,100 | 42.9% |
[ 24.5% - 25.0% ] 24.66% | 80,986 | 14.1% |
[ 25.5% - 26.0% ] 25.74% | 134,385 | 18.0% |
[ 26.0% - 26.5% ] 26.09% | 151,983 | 19.8% |
[ 26.0% - 26.5% ] 26.46% | 28,212 | 9.3% |
[ 26.5% - 27.0% ] 26.87% | 68,923 | 26.1% |
[ 27.5% - 28.0% ] 27.63% | 36,165 | 24.9% |
[ 28.0% - 28.5% ] 28.13% | 37,340 | 18.3% |
[ 28.5% - 29.0% ] 28.66% | 52,268 | 18.2% |
[ 28.5% - 29.0% ] 28.73% | 87,947 | 18.1% |
[ 29.5% - 30.0% ] 29.68% | 1,176 | 30.1% |
[ 30.5% - 31.0% ] 30.51% | 25,460 | 9.9% |
[ 30.5% - 31.0% ] 30.69% | 61,340 | 26.6% |
[ 32.5% - 33.0% ] 32.83% | 329 | 31.2% |
[ 34.5% - 35.0% ] 34.51% | 1,107 | 32.2% |
[ 35.5% - 36.0% ] 35.57% | 12,070 | 6.5% |
[ 36.0% - 36.5% ] 36.36% | 25,001 | 55.3% |
[ 36.5% - 37.0% ] 36.69% | 26,418 | 29.9% |
[ 39.0% - 39.5% ] 39.16% | 53,371 | 19.7% |
[ 46.0% - 46.5% ] 46.27% | 79,495 | 23.5% |