Immigrants from China Self-Care Disability
COMPARE
Immigrants from China
Select to Compare
Self-Care Disability
Immigrants from China Self-Care Disability
2.3%
SELF-CARE DISABILITY
99.1/ 100
METRIC RATING
76th/ 347
METRIC RANK
Immigrants from China Self-Care Disability Correlation Chart
The statistical analysis conducted on geographies consisting of 456,266,069 people shows a mild positive correlation between the proportion of Immigrants from China and percentage of population with self-care disability in the United States with a correlation coefficient (R) of 0.352 and weighted average of 2.3%. On average, for every 1% (one percent) increase in Immigrants from China within a typical geography, there is an increase of 0.048% in percentage of population with self-care disability.
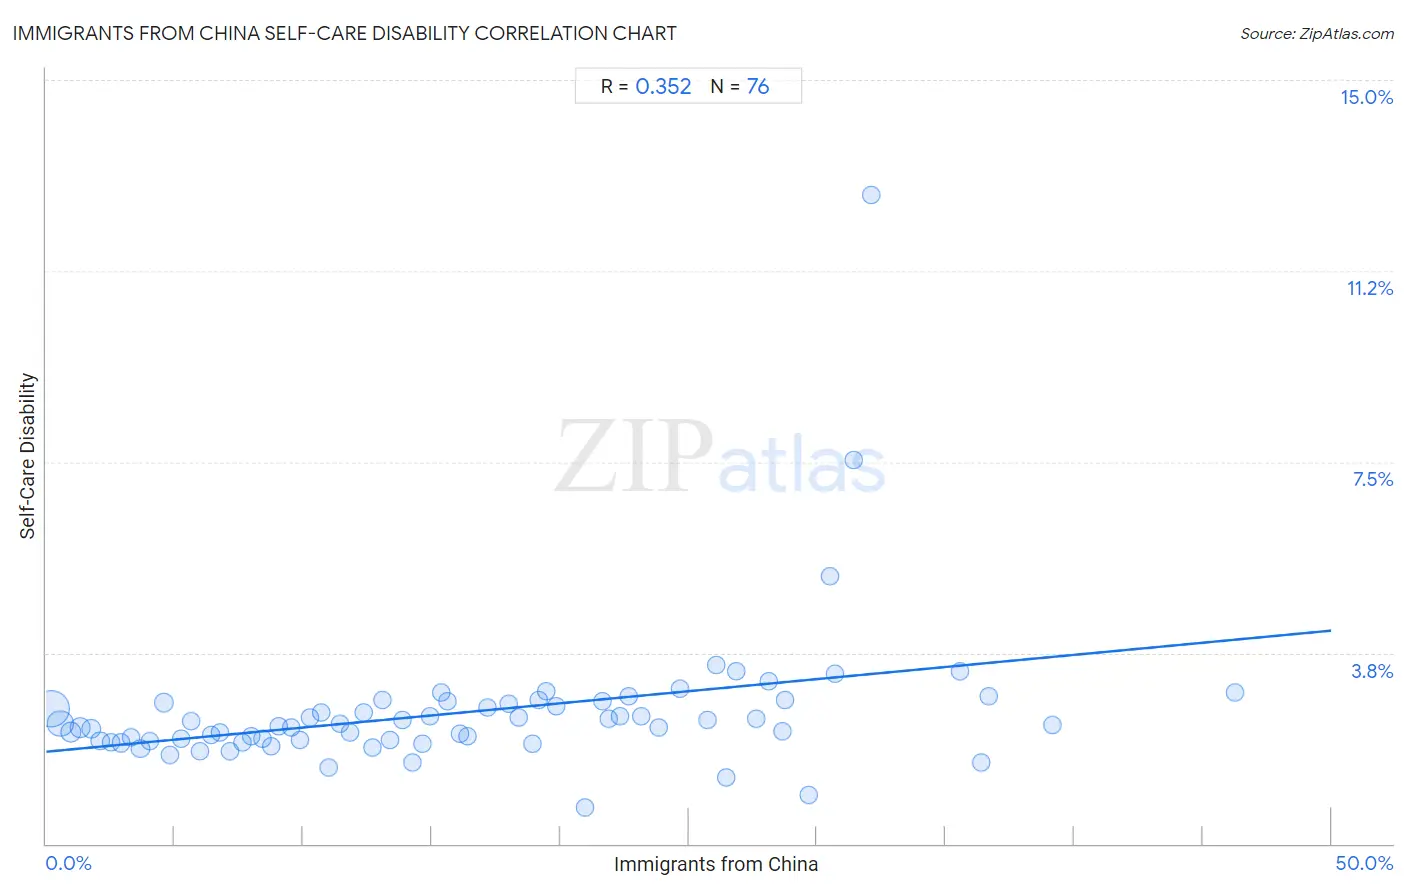
It is essential to understand that the correlation between the percentage of Immigrants from China and percentage of population with self-care disability does not imply a direct cause-and-effect relationship. It remains uncertain whether the presence of Immigrants from China influences an upward or downward trend in the level of percentage of population with self-care disability within an area, or if Immigrants from China simply ended up residing in those areas with higher or lower levels of percentage of population with self-care disability due to other factors.
Demographics Similar to Immigrants from China by Self-Care Disability
In terms of self-care disability, the demographic groups most similar to Immigrants from China are Immigrants from Netherlands (2.3%, a difference of 0.010%), Immigrants from Switzerland (2.3%, a difference of 0.050%), Immigrants from Middle Africa (2.3%, a difference of 0.080%), Immigrants from Ireland (2.3%, a difference of 0.080%), and Immigrants from Kenya (2.3%, a difference of 0.090%).
| Demographics | Rating | Rank | Self-Care Disability |
| Immigrants from Norway | 99.2 /100 | #69 | Exceptional 2.3% |
| Immigrants from Northern Europe | 99.2 /100 | #70 | Exceptional 2.3% |
| Asians | 99.2 /100 | #71 | Exceptional 2.3% |
| Eastern Europeans | 99.2 /100 | #72 | Exceptional 2.3% |
| Immigrants from Egypt | 99.1 /100 | #73 | Exceptional 2.3% |
| Immigrants from Switzerland | 99.1 /100 | #74 | Exceptional 2.3% |
| Immigrants from Netherlands | 99.1 /100 | #75 | Exceptional 2.3% |
| Immigrants from China | 99.1 /100 | #76 | Exceptional 2.3% |
| Immigrants from Middle Africa | 99.0 /100 | #77 | Exceptional 2.3% |
| Immigrants from Ireland | 99.0 /100 | #78 | Exceptional 2.3% |
| Immigrants from Kenya | 99.0 /100 | #79 | Exceptional 2.3% |
| Chileans | 98.8 /100 | #80 | Exceptional 2.3% |
| Ugandans | 98.8 /100 | #81 | Exceptional 2.3% |
| Immigrants from Denmark | 98.8 /100 | #82 | Exceptional 2.3% |
| Indians (Asian) | 98.7 /100 | #83 | Exceptional 2.3% |
Immigrants from China Self-Care Disability Correlation Summary
| Measurement | Immigrants from China Data | Self-Care Disability Data |
| Minimum | 0.17% | 0.71% |
| Maximum | 46.3% | 12.8% |
| Range | 46.1% | 12.0% |
| Mean | 16.3% | 2.6% |
| Median | 14.8% | 2.3% |
| Interquartile 25% (IQ1) | 7.4% | 2.0% |
| Interquartile 75% (IQ3) | 24.2% | 2.8% |
| Interquartile Range (IQR) | 16.9% | 0.75% |
| Standard Deviation (Sample) | 10.8% | 1.5% |
| Standard Deviation (Population) | 10.7% | 1.4% |
Correlation Details
| Immigrants from China Percentile | Sample Size | Self-Care Disability |
[ 0.0% - 0.5% ] 0.17% | 220,129,896 | 2.7% |
[ 0.5% - 1.0% ] 0.54% | 93,487,229 | 2.4% |
[ 0.5% - 1.0% ] 0.95% | 38,583,909 | 2.2% |
[ 1.0% - 1.5% ] 1.33% | 25,309,717 | 2.3% |
[ 1.5% - 2.0% ] 1.73% | 13,955,868 | 2.3% |
[ 2.0% - 2.5% ] 2.10% | 10,297,383 | 2.0% |
[ 2.5% - 3.0% ] 2.52% | 5,152,315 | 2.0% |
[ 2.5% - 3.0% ] 2.91% | 5,843,739 | 2.0% |
[ 3.0% - 3.5% ] 3.29% | 5,125,075 | 2.1% |
[ 3.5% - 4.0% ] 3.67% | 3,123,859 | 1.9% |
[ 4.0% - 4.5% ] 4.01% | 2,851,639 | 2.0% |
[ 4.5% - 5.0% ] 4.58% | 11,854,980 | 2.8% |
[ 4.5% - 5.0% ] 4.83% | 1,643,274 | 1.7% |
[ 5.0% - 5.5% ] 5.24% | 1,106,309 | 2.1% |
[ 5.5% - 6.0% ] 5.64% | 2,269,133 | 2.4% |
[ 6.0% - 6.5% ] 6.00% | 714,074 | 1.8% |
[ 6.0% - 6.5% ] 6.40% | 1,083,138 | 2.1% |
[ 6.5% - 7.0% ] 6.77% | 1,061,099 | 2.2% |
[ 7.0% - 7.5% ] 7.15% | 1,057,148 | 1.8% |
[ 7.5% - 8.0% ] 7.62% | 696,702 | 2.0% |
[ 7.5% - 8.0% ] 7.99% | 977,509 | 2.1% |
[ 8.0% - 8.5% ] 8.40% | 886,088 | 2.1% |
[ 8.5% - 9.0% ] 8.76% | 344,960 | 1.9% |
[ 9.0% - 9.5% ] 9.04% | 681,538 | 2.3% |
[ 9.5% - 10.0% ] 9.56% | 425,525 | 2.3% |
[ 9.5% - 10.0% ] 9.88% | 604,428 | 2.0% |
[ 10.0% - 10.5% ] 10.25% | 272,128 | 2.5% |
[ 10.5% - 11.0% ] 10.70% | 347,846 | 2.6% |
[ 10.5% - 11.0% ] 10.99% | 435,671 | 1.5% |
[ 11.0% - 11.5% ] 11.41% | 531,653 | 2.4% |
[ 11.5% - 12.0% ] 11.81% | 167,233 | 2.2% |
[ 12.0% - 12.5% ] 12.35% | 1,056,987 | 2.6% |
[ 12.5% - 13.0% ] 12.68% | 383,600 | 1.9% |
[ 13.0% - 13.5% ] 13.06% | 273,045 | 2.8% |
[ 13.0% - 13.5% ] 13.39% | 360,552 | 2.0% |
[ 13.5% - 14.0% ] 13.86% | 120,497 | 2.4% |
[ 14.0% - 14.5% ] 14.27% | 47,202 | 1.6% |
[ 14.5% - 15.0% ] 14.63% | 97,288 | 2.0% |
[ 14.5% - 15.0% ] 14.93% | 110,434 | 2.5% |
[ 15.0% - 15.5% ] 15.39% | 40,627 | 3.0% |
[ 15.5% - 16.0% ] 15.59% | 744 | 2.8% |
[ 16.0% - 16.5% ] 16.11% | 183,427 | 2.2% |
[ 16.0% - 16.5% ] 16.38% | 50,637 | 2.1% |
[ 17.0% - 17.5% ] 17.19% | 148,790 | 2.7% |
[ 18.0% - 18.5% ] 18.02% | 111,247 | 2.8% |
[ 18.0% - 18.5% ] 18.40% | 312,200 | 2.5% |
[ 18.5% - 19.0% ] 18.92% | 113,241 | 2.0% |
[ 19.0% - 19.5% ] 19.18% | 235,005 | 2.8% |
[ 19.0% - 19.5% ] 19.44% | 45,650 | 3.0% |
[ 19.5% - 20.0% ] 19.85% | 131,923 | 2.7% |
[ 20.5% - 21.0% ] 20.98% | 13,722 | 0.71% |
[ 21.5% - 22.0% ] 21.65% | 89,075 | 2.8% |
[ 21.5% - 22.0% ] 21.87% | 143,740 | 2.5% |
[ 22.0% - 22.5% ] 22.31% | 102,223 | 2.5% |
[ 22.5% - 23.0% ] 22.68% | 85,306 | 2.9% |
[ 23.0% - 23.5% ] 23.13% | 24,169 | 2.5% |
[ 23.5% - 24.0% ] 23.82% | 1,100 | 2.3% |
[ 24.5% - 25.0% ] 24.66% | 80,986 | 3.0% |
[ 25.5% - 26.0% ] 25.74% | 134,385 | 2.4% |
[ 26.0% - 26.5% ] 26.09% | 151,983 | 3.5% |
[ 26.0% - 26.5% ] 26.46% | 28,212 | 1.3% |
[ 26.5% - 27.0% ] 26.87% | 68,923 | 3.4% |
[ 27.5% - 28.0% ] 27.63% | 36,165 | 2.5% |
[ 28.0% - 28.5% ] 28.13% | 37,340 | 3.2% |
[ 28.5% - 29.0% ] 28.66% | 52,268 | 2.2% |
[ 28.5% - 29.0% ] 28.73% | 87,947 | 2.8% |
[ 29.5% - 30.0% ] 29.68% | 1,176 | 0.96% |
[ 30.5% - 31.0% ] 30.51% | 25,460 | 5.3% |
[ 30.5% - 31.0% ] 30.69% | 60,386 | 3.3% |
[ 31.0% - 31.5% ] 31.42% | 557 | 7.5% |
[ 32.0% - 32.5% ] 32.09% | 430 | 12.8% |
[ 35.5% - 36.0% ] 35.57% | 12,070 | 3.4% |
[ 36.0% - 36.5% ] 36.36% | 25,001 | 1.6% |
[ 36.5% - 37.0% ] 36.69% | 26,418 | 2.9% |
[ 39.0% - 39.5% ] 39.16% | 53,371 | 2.3% |
[ 46.0% - 46.5% ] 46.27% | 79,495 | 3.0% |