Immigrants from Africa Disability Age Under 5

COMPARE

Immigrants from Africa
Race
Ancestry
AfghanAfricanAlaska NativeAlaskan AthabascanAlbanianAleutAlsatianAmericanApacheArabArapahoArgentineanArmenianAssyrian/Chaldean/SyriacAustralianAustrianBahamianBangladeshiBarbadianBasqueBelgianBelizeanBermudanBhutaneseBlackfeetBolivianBrazilianBritishBritish West IndianBulgarianBurmeseCajunCambodianCanadianCape VerdeanCarpatho RusynCelticCentral AmericanCentral American IndianCherokeeCheyenneChickasawChileanChineseChippewaChoctawColombianColvilleComancheCosta RicanCreeCreekCroatianCrowCubanCypriotCzechCzechoslovakianDanishDelawareDominicanDutchDutch West IndianEastern EuropeanEcuadorianEgyptianEnglishEstonianEthiopianEuropeanFijianFilipinoFinnishFrenchFrench American IndianFrench CanadianGermanGerman RussianGhanaianGreekGuamanian/ChamorroGuatemalanGuyaneseHaitianHmongHonduranHopiHoumaHungarianIcelanderIndian (Asian)IndonesianInupiatIranianIraqiIrishIroquoisIsraeliItalianJamaicanJapaneseJordanianKenyanKiowaKoreanLaotianLatvianLebaneseLiberianLithuanianLumbeeLuxembourgerMacedonianMalaysianMalteseMarshalleseMenomineeMexicanMexican American IndianMongolianMoroccanNative HawaiianNavajoNepaleseNew ZealanderNicaraguanNigerianNorthern EuropeanNorwegianOkinawanOsageOttawaPaiutePakistaniPalestinianPanamanianParaguayanPennsylvania GermanPeruvianPimaPolishPortuguesePotawatomiPuebloPuerto RicanPuget Sound SalishRomanianRussianSalvadoranSamoanScandinavianScotch-IrishScottishSeminoleSenegaleseSerbianShoshoneSierra LeoneanSiouxSlavicSlovakSloveneSomaliSouth AfricanSouth AmericanSouth American IndianSoviet UnionSpaniardSpanishSpanish AmericanSpanish American IndianSri LankanSubsaharan AfricanSudaneseSwedishSwissSyrianTaiwaneseThaiTlingit-HaidaTohono O'OdhamTonganTrinidadian and TobagonianTsimshianTurkishU.S. Virgin IslanderUgandanUkrainianUruguayanUteVenezuelanVietnameseWelshWest IndianYakamaYaquiYugoslavianYumanYup'ikZimbabwean
Immigration
NonimmigrantsImmigrantsAfghanistanAfricaAlbaniaArgentinaArmeniaAsiaAustraliaAustriaBahamasBangladeshBarbadosBelarusBelgiumBelizeBoliviaBosnia and HerzegovinaBrazilBulgariaBurma/MyanmarCabo VerdeCambodiaCameroonCanadaCaribbeanCentral AmericaChileChinaColombiaCongoCosta RicaCroatiaCubaCzechoslovakiaDenmarkDominicaDominican RepublicEastern AfricaEastern AsiaEastern EuropeEcuadorEgyptEl SalvadorEnglandEritreaEthiopiaEuropeFijiFranceGermanyGhanaGreeceGrenadaGuatemalaGuyanaHaitiHondurasHong KongHungaryIndiaIndonesiaIranIraqIrelandIsraelItalyJamaicaJapanJordanKazakhstanKenyaKoreaKuwaitLaosLatin AmericaLatviaLebanonLiberiaLithuaniaMalaysiaMexicoMicronesiaMiddle AfricaMoldovaMoroccoNepalNetherlandsNicaraguaNigeriaNorth AmericaNorth MacedoniaNorthern AfricaNorthern EuropeNorwayOceaniaPakistanPanamaPeruPhilippinesPolandPortugalRomaniaRussiaSaudi ArabiaScotlandSenegalSerbiaSierra LeoneSingaporeSomaliaSouth AfricaSouth AmericaSouth Central AsiaSouth Eastern AsiaSouthern EuropeSpainSri LankaSt. Vincent and the GrenadinesSudanSwedenSwitzerlandSyriaTaiwanThailandTrinidad and TobagoTurkeyUgandaUkraineUruguayUzbekistanVenezuelaVietnamWest IndiesWestern AfricaWestern AsiaWestern EuropeYemenZaireZimbabweAzores
Select to Compare
Race
Ancestry
AfghanAfricanAlaska NativeAlaskan AthabascanAlbanianAleutAlsatianAmericanApacheArabArapahoArgentineanArmenianAssyrian/Chaldean/SyriacAustralianAustrianBahamianBangladeshiBarbadianBasqueBelgianBelizeanBermudanBhutaneseBlackfeetBolivianBrazilianBritishBritish West IndianBulgarianBurmeseCajunCambodianCanadianCape VerdeanCarpatho RusynCelticCentral AmericanCentral American IndianCherokeeCheyenneChickasawChileanChineseChippewaChoctawColombianColvilleComancheCosta RicanCreeCreekCroatianCrowCubanCypriotCzechCzechoslovakianDanishDelawareDominicanDutchDutch West IndianEastern EuropeanEcuadorianEgyptianEnglishEstonianEthiopianEuropeanFijianFilipinoFinnishFrenchFrench American IndianFrench CanadianGermanGerman RussianGhanaianGreekGuamanian/ChamorroGuatemalanGuyaneseHaitianHmongHonduranHopiHoumaHungarianIcelanderIndian (Asian)IndonesianInupiatIranianIraqiIrishIroquoisIsraeliItalianJamaicanJapaneseJordanianKenyanKiowaKoreanLaotianLatvianLebaneseLiberianLithuanianLumbeeLuxembourgerMacedonianMalaysianMalteseMarshalleseMenomineeMexicanMexican American IndianMongolianMoroccanNative HawaiianNavajoNepaleseNew ZealanderNicaraguanNigerianNorthern EuropeanNorwegianOkinawanOsageOttawaPaiutePakistaniPalestinianPanamanianParaguayanPennsylvania GermanPeruvianPimaPolishPortuguesePotawatomiPuebloPuerto RicanPuget Sound SalishRomanianRussianSalvadoranSamoanScandinavianScotch-IrishScottishSeminoleSenegaleseSerbianShoshoneSierra LeoneanSiouxSlavicSlovakSloveneSomaliSouth AfricanSouth AmericanSouth American IndianSoviet UnionSpaniardSpanishSpanish AmericanSpanish American IndianSri LankanSubsaharan AfricanSudaneseSwedishSwissSyrianTaiwaneseThaiTlingit-HaidaTohono O'OdhamTonganTrinidadian and TobagonianTsimshianTurkishU.S. Virgin IslanderUgandanUkrainianUruguayanUteVenezuelanVietnameseWelshWest IndianYakamaYaquiYugoslavianYumanYup'ikZimbabwean
Immigration
NonimmigrantsImmigrantsAfghanistanAlbaniaArgentinaArmeniaAsiaAustraliaAustriaBahamasBangladeshBarbadosBelarusBelgiumBelizeBoliviaBosnia and HerzegovinaBrazilBulgariaBurma/MyanmarCabo VerdeCambodiaCameroonCanadaCaribbeanCentral AmericaChileChinaColombiaCongoCosta RicaCroatiaCubaCzechoslovakiaDenmarkDominicaDominican RepublicEastern AfricaEastern AsiaEastern EuropeEcuadorEgyptEl SalvadorEnglandEritreaEthiopiaEuropeFijiFranceGermanyGhanaGreeceGrenadaGuatemalaGuyanaHaitiHondurasHong KongHungaryIndiaIndonesiaIranIraqIrelandIsraelItalyJamaicaJapanJordanKazakhstanKenyaKoreaKuwaitLaosLatin AmericaLatviaLebanonLiberiaLithuaniaMalaysiaMexicoMicronesiaMiddle AfricaMoldovaMoroccoNepalNetherlandsNicaraguaNigeriaNorth AmericaNorth MacedoniaNorthern AfricaNorthern EuropeNorwayOceaniaPakistanPanamaPeruPhilippinesPolandPortugalRomaniaRussiaSaudi ArabiaScotlandSenegalSerbiaSierra LeoneSingaporeSomaliaSouth AfricaSouth AmericaSouth Central AsiaSouth Eastern AsiaSouthern EuropeSpainSri LankaSt. Vincent and the GrenadinesSudanSwedenSwitzerlandSyriaTaiwanThailandTrinidad and TobagoTurkeyUgandaUkraineUruguayUzbekistanVenezuelaVietnamWest IndiesWestern AfricaWestern AsiaWestern EuropeYemenZaireZimbabweAzores
Disability Age Under 5
Income
Poverty
Unemployment
Labor Participation
Family Structure
Vehicle Availability
Education Level
Disability

Immigrants from Africa Disability Age Under 5
Good

1.2%
DISABILITY | AGE UNDER 5
65.1/ 100
METRIC RATING
161st/ 347
METRIC RANK

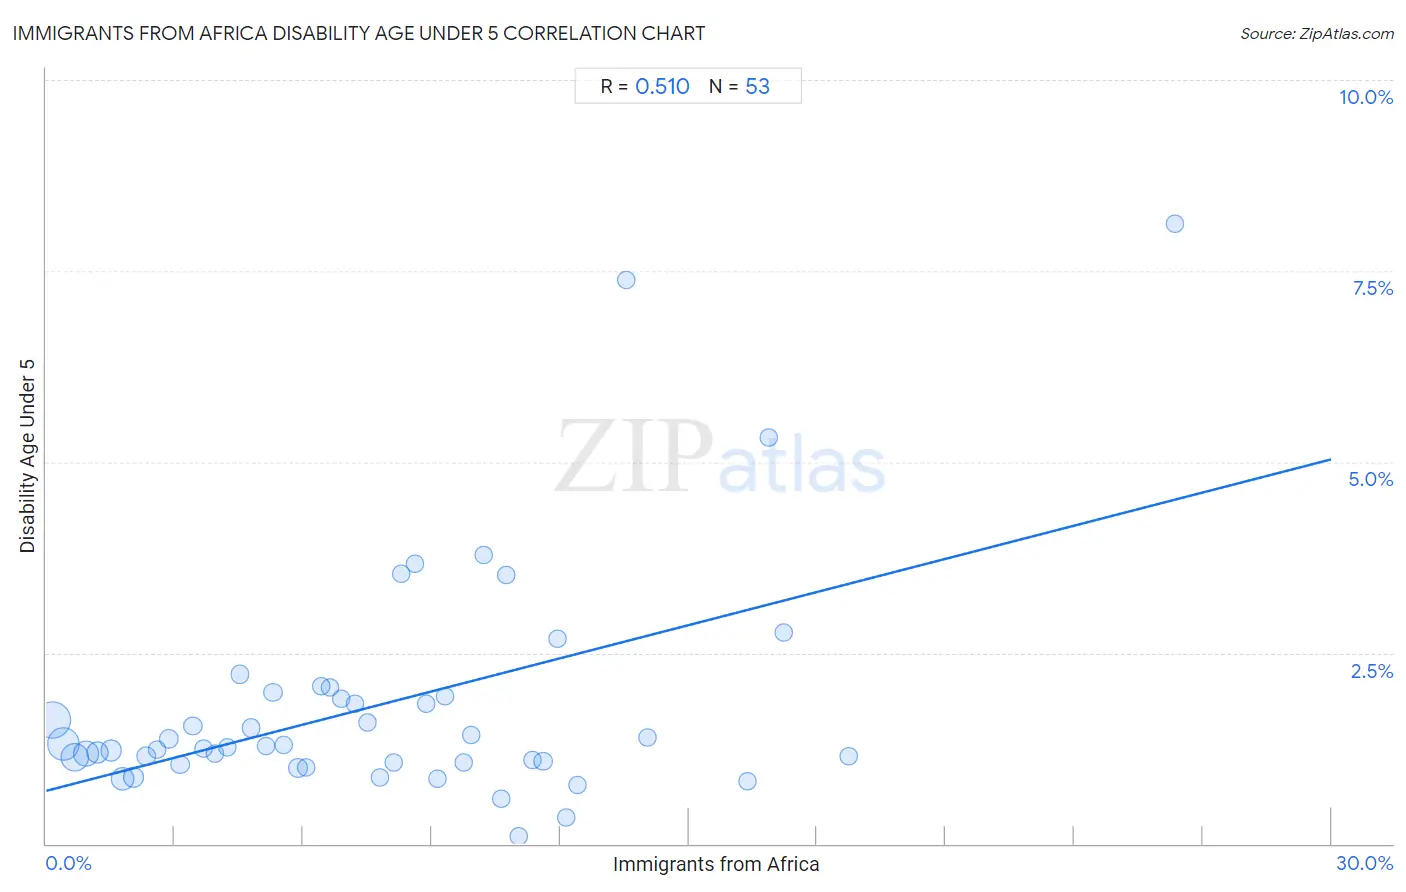
Immigrants from Africa Disability Age Under 5 Correlation Chart

The statistical analysis conducted on geographies consisting of 240,976,621 people shows a substantial positive correlation between the proportion of Immigrants from Africa and percentage of population with a disability under the age of 5 in the United States with a correlation coefficient (R) of 0.510 and weighted average of 1.2%. On average, for every 1% (one percent) increase in Immigrants from Africa within a typical geography, there is an increase of 0.14% in percentage of population with a disability under the age of 5.
Immigrants from Africa Disability Age Under 5
It is essential to understand that the correlation between the percentage of Immigrants from Africa and percentage of population with a disability under the age of 5 does not imply a direct cause-and-effect relationship. It remains uncertain whether the presence of Immigrants from Africa influences an upward or downward trend in the level of percentage of population with a disability under the age of 5 within an area, or if Immigrants from Africa simply ended up residing in those areas with higher or lower levels of percentage of population with a disability under the age of 5 due to other factors.

Demographics Similar to Immigrants from Africa by Disability Age Under 5

In terms of disability age under 5, the demographic groups most similar to Immigrants from Africa are Colombian (1.2%, a difference of 0.070%), Immigrants from Latin America (1.2%, a difference of 0.070%), Arab (1.2%, a difference of 0.13%), Guatemalan (1.2%, a difference of 0.15%), and Immigrants from South America (1.2%, a difference of 0.19%).
DemographicsRating | RankDisability Age Under 5
Uruguayans
68.8
/100
|
#154
Good
1.2%
Immigrants from Ghana
68.7
/100
|
#155
Good
1.2%
Hawaiians
68.5
/100
|
#156
Good
1.2%
Immigrants from South America
67.0
/100
|
#157
Good
1.2%
Arabs
66.4
/100
|
#158
Good
1.2%
Colombians
65.8
/100
|
#159
Good
1.2%
Immigrants from Latin America
65.8
/100
|
#160
Good
1.2%
Immigrants from Africa
65.1
/100
|
#161
Good
1.2%
Guatemalans
63.6
/100
|
#162
Good
1.2%
Immigrants from Guatemala
63.2
/100
|
#163
Good
1.2%
Laotians
62.8
/100
|
#164
Good
1.2%
Immigrants from Kuwait
62.6
/100
|
#165
Good
1.2%
Immigrants from Central America
61.4
/100
|
#166
Good
1.2%
Immigrants from Argentina
60.2
/100
|
#167
Good
1.2%
Sierra Leoneans
59.1
/100
|
#168
Average
1.2%

Immigrants from Africa Disability Age Under 5 Correlation Summary

MeasurementImmigrants from Africa DataDisability Age Under 5 Data
Minimum0.13%0.10%
Maximum26.4%8.1%
Range26.2%8.0%
Mean7.8%1.8%
Median7.2%1.3%
Interquartile 25% (IQ1)3.5%1.1%
Interquartile 75% (IQ3)10.9%2.0%
Interquartile Range (IQR)7.3%0.89%
Standard Deviation (Sample)5.4%1.5%
Standard Deviation (Population)5.3%1.5%

Correlation Details

Immigrants from Africa PercentileSample SizeDisability Age Under 5
[
0.0%
-
0.5%
]
0.13%
61,475,7961.6%
[
0.0%
-
0.5%
]
0.40%
47,619,3151.3%
[
0.5%
-
1.0%
]
0.67%
34,200,1871.1%
[
0.5%
-
1.0%
]
0.94%
25,453,7611.2%
[
1.0%
-
1.5%
]
1.21%
12,301,4681.2%
[
1.5%
-
2.0%
]
1.50%
8,942,9931.2%
[
1.5%
-
2.0%
]
1.78%
15,822,4290.84%
[
2.0%
-
2.5%
]
2.04%
9,709,5470.87%
[
2.0%
-
2.5%
]
2.33%
4,142,4821.2%
[
2.5%
-
3.0%
]
2.59%
2,564,4871.2%
[
2.5%
-
3.0%
]
2.85%
3,468,7981.4%
[
3.0%
-
3.5%
]
3.13%
2,865,1601.0%
[
3.0%
-
3.5%
]
3.42%
1,865,2641.5%
[
3.5%
-
4.0%
]
3.66%
1,284,3511.2%
[
3.5%
-
4.0%
]
3.93%
715,5521.2%
[
4.0%
-
4.5%
]
4.22%
891,2951.3%
[
4.5%
-
5.0%
]
4.53%
295,5702.2%
[
4.5%
-
5.0%
]
4.79%
879,7191.5%
[
5.0%
-
5.5%
]
5.12%
1,399,8131.3%
[
5.0%
-
5.5%
]
5.30%
762,8552.0%
[
5.5%
-
6.0%
]
5.54%
505,9571.3%
[
5.5%
-
6.0%
]
5.88%
902,7520.99%
[
6.0%
-
6.5%
]
6.07%
296,7101.00%
[
6.0%
-
6.5%
]
6.41%
98,6992.1%
[
6.5%
-
7.0%
]
6.63%
164,9772.0%
[
6.5%
-
7.0%
]
6.89%
263,2661.9%
[
7.0%
-
7.5%
]
7.20%
287,8221.8%
[
7.5%
-
8.0%
]
7.51%
126,9711.6%
[
7.5%
-
8.0%
]
7.80%
272,4570.86%
[
8.0%
-
8.5%
]
8.12%
67,0191.1%
[
8.0%
-
8.5%
]
8.28%
56,3373.5%
[
8.5%
-
9.0%
]
8.62%
76,1143.7%
[
8.5%
-
9.0%
]
8.86%
109,5481.8%
[
9.0%
-
9.5%
]
9.15%
120,2840.85%
[
9.0%
-
9.5%
]
9.30%
27,6041.9%
[
9.5%
-
10.0%
]
9.76%
108,7391.1%
[
9.5%
-
10.0%
]
9.93%
78,1651.4%
[
10.0%
-
10.5%
]
10.21%
67,8343.8%
[
10.5%
-
11.0%
]
10.61%
99,8000.59%
[
10.5%
-
11.0%
]
10.74%
28,2973.5%
[
11.0%
-
11.5%
]
11.03%
35,9080.10%
[
11.0%
-
11.5%
]
11.37%
42,3051.1%
[
11.5%
-
12.0%
]
11.60%
65,8791.1%
[
11.5%
-
12.0%
]
11.95%
30,6252.7%
[
12.0%
-
12.5%
]
12.14%
109,7360.34%
[
12.0%
-
12.5%
]
12.41%
49,7110.78%
[
13.5%
-
14.0%
]
13.53%
1,9367.4%
[
14.0%
-
14.5%
]
14.03%
54,0731.4%
[
16.0%
-
16.5%
]
16.36%
63,0470.82%
[
16.5%
-
17.0%
]
16.87%
25,9875.3%
[
17.0%
-
17.5%
]
17.20%
56,5322.8%
[
18.5%
-
19.0%
]
18.73%
19,5311.2%
[
26.0%
-
26.5%
]
26.36%
1,1578.1%