Immigrants from Africa 4 or more Vehicles in Household
COMPARE
Immigrants from Africa
Select to Compare
4 or more Vehicles in Household
Immigrants from Africa 4 or more Vehicles in Household
5.6%
4+ VEHICLES AVAILABLE
1.0/ 100
METRIC RATING
264th/ 347
METRIC RANK
Immigrants from Africa 4 or more Vehicles in Household Correlation Chart
The statistical analysis conducted on geographies consisting of 466,853,730 people shows a poor positive correlation between the proportion of Immigrants from Africa and percentage of households with 4 or more vehicles available in the United States with a correlation coefficient (R) of 0.183 and weighted average of 5.6%. On average, for every 1% (one percent) increase in Immigrants from Africa within a typical geography, there is an increase of 0.073% in percentage of households with 4 or more vehicles available.
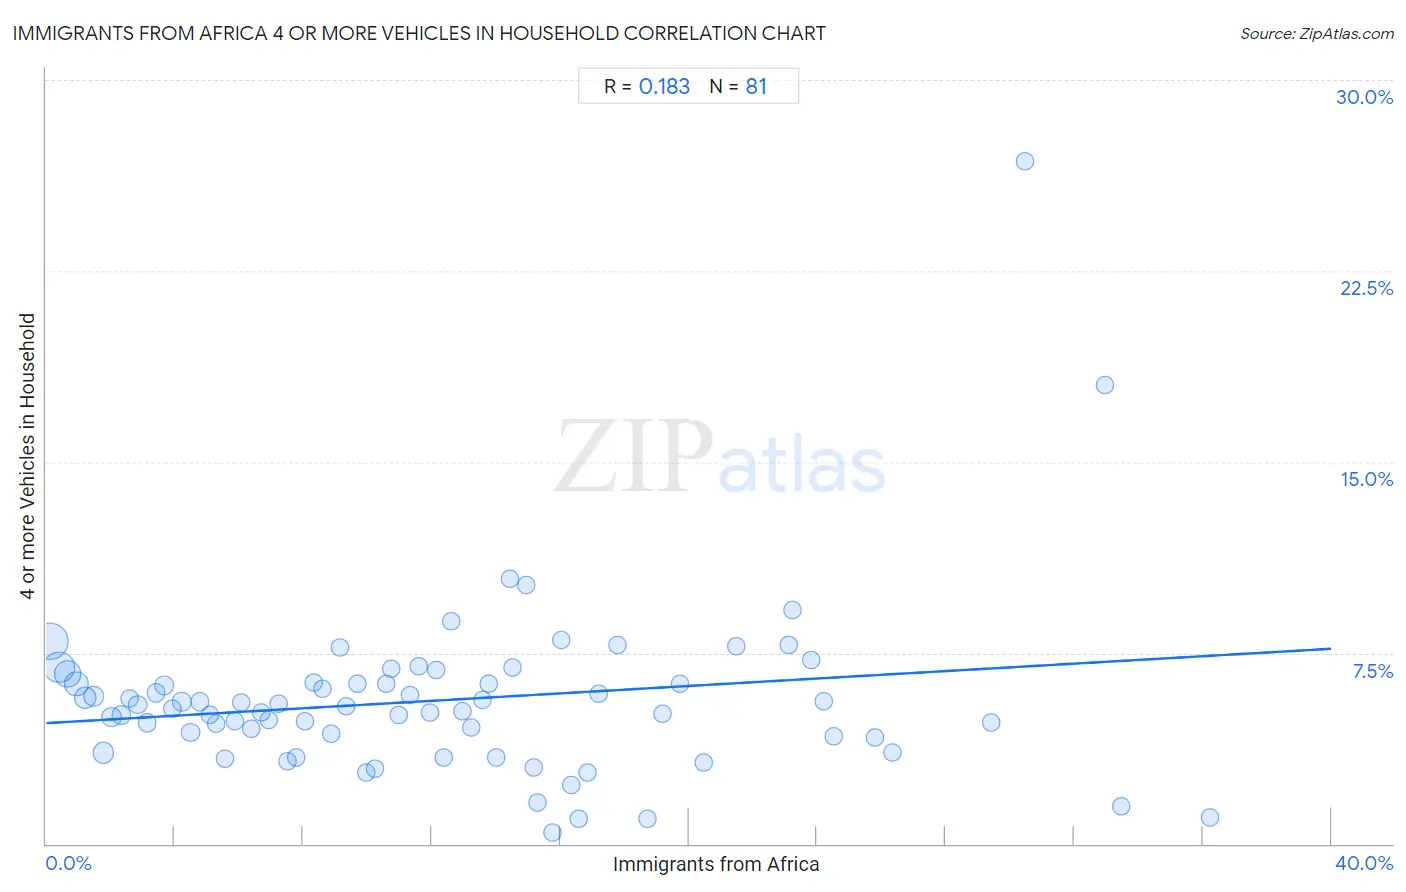
It is essential to understand that the correlation between the percentage of Immigrants from Africa and percentage of households with 4 or more vehicles available does not imply a direct cause-and-effect relationship. It remains uncertain whether the presence of Immigrants from Africa influences an upward or downward trend in the level of percentage of households with 4 or more vehicles available within an area, or if Immigrants from Africa simply ended up residing in those areas with higher or lower levels of percentage of households with 4 or more vehicles available due to other factors.
Demographics Similar to Immigrants from Africa by 4 or more Vehicles in Household
In terms of 4 or more vehicles in household, the demographic groups most similar to Immigrants from Africa are South American (5.6%, a difference of 0.22%), Immigrants from Nepal (5.6%, a difference of 0.24%), Immigrants from Ukraine (5.6%, a difference of 0.32%), Immigrants from Saudi Arabia (5.6%, a difference of 0.54%), and Bermudan (5.6%, a difference of 0.63%).
| Demographics | Rating | Rank | 4 or more Vehicles in Household |
| Immigrants from Northern Africa | 1.4 /100 | #257 | Tragic 5.6% |
| Immigrants from Lithuania | 1.4 /100 | #258 | Tragic 5.6% |
| Immigrants from France | 1.3 /100 | #259 | Tragic 5.6% |
| Uruguayans | 1.3 /100 | #260 | Tragic 5.6% |
| Sudanese | 1.2 /100 | #261 | Tragic 5.6% |
| Bermudans | 1.2 /100 | #262 | Tragic 5.6% |
| Immigrants from Saudi Arabia | 1.1 /100 | #263 | Tragic 5.6% |
| Immigrants from Africa | 1.0 /100 | #264 | Tragic 5.6% |
| South Americans | 0.9 /100 | #265 | Tragic 5.6% |
| Immigrants from Nepal | 0.9 /100 | #266 | Tragic 5.6% |
| Immigrants from Ukraine | 0.9 /100 | #267 | Tragic 5.6% |
| Colombians | 0.7 /100 | #268 | Tragic 5.5% |
| Carpatho Rusyns | 0.7 /100 | #269 | Tragic 5.5% |
| Okinawans | 0.6 /100 | #270 | Tragic 5.5% |
| Immigrants from Sudan | 0.6 /100 | #271 | Tragic 5.5% |
Immigrants from Africa 4 or more Vehicles in Household Correlation Summary
| Measurement | Immigrants from Africa Data | 4 or more Vehicles in Household Data |
| Minimum | 0.13% | 0.46% |
| Maximum | 36.2% | 26.8% |
| Range | 36.1% | 26.3% |
| Mean | 12.3% | 5.6% |
| Median | 11.0% | 5.4% |
| Interquartile 25% (IQ1) | 5.4% | 4.2% |
| Interquartile 75% (IQ3) | 16.7% | 6.3% |
| Interquartile Range (IQR) | 11.3% | 2.1% |
| Standard Deviation (Sample) | 8.6% | 3.4% |
| Standard Deviation (Population) | 8.5% | 3.4% |
Correlation Details
| Immigrants from Africa Percentile | Sample Size | 4 or more Vehicles in Household |
[ 0.0% - 0.5% ] 0.13% | 137,305,911 | 7.9% |
[ 0.0% - 0.5% ] 0.40% | 95,300,006 | 6.9% |
[ 0.5% - 1.0% ] 0.67% | 61,789,345 | 6.7% |
[ 0.5% - 1.0% ] 0.94% | 43,961,561 | 6.3% |
[ 1.0% - 1.5% ] 1.21% | 23,874,169 | 5.7% |
[ 1.0% - 1.5% ] 1.50% | 17,655,559 | 5.8% |
[ 1.5% - 2.0% ] 1.78% | 23,385,954 | 3.6% |
[ 2.0% - 2.5% ] 2.04% | 14,394,594 | 5.0% |
[ 2.0% - 2.5% ] 2.32% | 7,855,266 | 5.1% |
[ 2.5% - 3.0% ] 2.59% | 5,274,034 | 5.7% |
[ 2.5% - 3.0% ] 2.85% | 5,877,850 | 5.5% |
[ 3.0% - 3.5% ] 3.14% | 4,469,193 | 4.7% |
[ 3.0% - 3.5% ] 3.41% | 3,459,064 | 5.9% |
[ 3.5% - 4.0% ] 3.67% | 2,627,704 | 6.2% |
[ 3.5% - 4.0% ] 3.92% | 1,618,402 | 5.3% |
[ 4.0% - 4.5% ] 4.22% | 1,693,908 | 5.6% |
[ 4.0% - 4.5% ] 4.49% | 1,395,751 | 4.4% |
[ 4.5% - 5.0% ] 4.78% | 1,531,185 | 5.6% |
[ 5.0% - 5.5% ] 5.09% | 2,112,176 | 5.1% |
[ 5.0% - 5.5% ] 5.30% | 1,237,089 | 4.7% |
[ 5.5% - 6.0% ] 5.56% | 754,986 | 3.3% |
[ 5.5% - 6.0% ] 5.86% | 1,471,608 | 4.8% |
[ 6.0% - 6.5% ] 6.08% | 791,592 | 5.5% |
[ 6.0% - 6.5% ] 6.40% | 587,650 | 4.5% |
[ 6.5% - 7.0% ] 6.68% | 495,514 | 5.1% |
[ 6.5% - 7.0% ] 6.92% | 546,835 | 4.9% |
[ 7.0% - 7.5% ] 7.23% | 464,144 | 5.5% |
[ 7.0% - 7.5% ] 7.50% | 236,890 | 3.3% |
[ 7.5% - 8.0% ] 7.80% | 464,663 | 3.4% |
[ 8.0% - 8.5% ] 8.05% | 249,770 | 4.8% |
[ 8.0% - 8.5% ] 8.32% | 272,744 | 6.3% |
[ 8.5% - 9.0% ] 8.61% | 224,610 | 6.1% |
[ 8.5% - 9.0% ] 8.88% | 165,245 | 4.3% |
[ 9.0% - 9.5% ] 9.13% | 271,410 | 7.7% |
[ 9.0% - 9.5% ] 9.34% | 175,960 | 5.4% |
[ 9.5% - 10.0% ] 9.71% | 414,213 | 6.3% |
[ 9.5% - 10.0% ] 9.94% | 112,394 | 2.8% |
[ 10.0% - 10.5% ] 10.23% | 199,793 | 2.9% |
[ 10.5% - 11.0% ] 10.60% | 106,284 | 6.3% |
[ 10.5% - 11.0% ] 10.74% | 31,403 | 6.9% |
[ 10.5% - 11.0% ] 10.99% | 219,819 | 5.0% |
[ 11.0% - 11.5% ] 11.33% | 128,994 | 5.8% |
[ 11.5% - 12.0% ] 11.59% | 174,030 | 7.0% |
[ 11.5% - 12.0% ] 11.94% | 47,305 | 5.2% |
[ 12.0% - 12.5% ] 12.12% | 198,710 | 6.8% |
[ 12.0% - 12.5% ] 12.39% | 85,199 | 3.4% |
[ 12.5% - 13.0% ] 12.60% | 31,679 | 8.7% |
[ 12.5% - 13.0% ] 12.94% | 214,064 | 5.2% |
[ 13.0% - 13.5% ] 13.24% | 107,782 | 4.5% |
[ 13.5% - 14.0% ] 13.57% | 150,466 | 5.7% |
[ 13.5% - 14.0% ] 13.77% | 65,413 | 6.3% |
[ 14.0% - 14.5% ] 14.03% | 54,073 | 3.4% |
[ 14.0% - 14.5% ] 14.44% | 2,348 | 10.4% |
[ 14.5% - 15.0% ] 14.50% | 29,687 | 6.9% |
[ 14.5% - 15.0% ] 14.95% | 37,693 | 10.2% |
[ 15.0% - 15.5% ] 15.19% | 29,516 | 3.0% |
[ 15.0% - 15.5% ] 15.28% | 28,172 | 1.6% |
[ 15.5% - 16.0% ] 15.75% | 16,076 | 0.46% |
[ 16.0% - 16.5% ] 16.03% | 36,105 | 8.0% |
[ 16.0% - 16.5% ] 16.33% | 72,621 | 2.3% |
[ 16.5% - 17.0% ] 16.59% | 31,018 | 0.97% |
[ 16.5% - 17.0% ] 16.87% | 25,987 | 2.8% |
[ 17.0% - 17.5% ] 17.20% | 56,532 | 5.9% |
[ 17.5% - 18.0% ] 17.78% | 27,919 | 7.8% |
[ 18.5% - 19.0% ] 18.73% | 19,531 | 0.99% |
[ 19.0% - 19.5% ] 19.16% | 981 | 5.1% |
[ 19.5% - 20.0% ] 19.71% | 13,580 | 6.3% |
[ 20.0% - 20.5% ] 20.48% | 332 | 3.2% |
[ 21.0% - 21.5% ] 21.47% | 8,290 | 7.7% |
[ 23.0% - 23.5% ] 23.11% | 7,703 | 7.8% |
[ 23.0% - 23.5% ] 23.22% | 267 | 9.2% |
[ 23.5% - 24.0% ] 23.82% | 14,553 | 7.2% |
[ 24.0% - 24.5% ] 24.22% | 2,849 | 5.6% |
[ 24.5% - 25.0% ] 24.51% | 5,011 | 4.2% |
[ 25.5% - 26.0% ] 25.78% | 26,684 | 4.2% |
[ 26.0% - 26.5% ] 26.36% | 1,157 | 3.6% |
[ 29.0% - 29.5% ] 29.42% | 15,489 | 4.8% |
[ 30.0% - 30.5% ] 30.48% | 105 | 26.8% |
[ 32.5% - 33.0% ] 32.97% | 182 | 18.0% |
[ 33.0% - 33.5% ] 33.47% | 487 | 1.5% |
[ 36.0% - 36.5% ] 36.22% | 8,892 | 1.0% |