Immigrants from Africa 1 or more Vehicles in Household
COMPARE
Immigrants from Africa
Select to Compare
1 or more Vehicles in Household
Immigrants from Africa 1 or more Vehicles in Household
87.6%
1+ VEHICLES AVAILABLE
0.2/ 100
METRIC RATING
269th/ 347
METRIC RANK
Immigrants from Africa 1 or more Vehicles in Household Correlation Chart
The statistical analysis conducted on geographies consisting of 468,980,674 people shows a mild positive correlation between the proportion of Immigrants from Africa and percentage of households with 1 or more vehicles available in the United States with a correlation coefficient (R) of 0.332 and weighted average of 87.6%. On average, for every 1% (one percent) increase in Immigrants from Africa within a typical geography, there is an increase of 0.22% in percentage of households with 1 or more vehicles available.
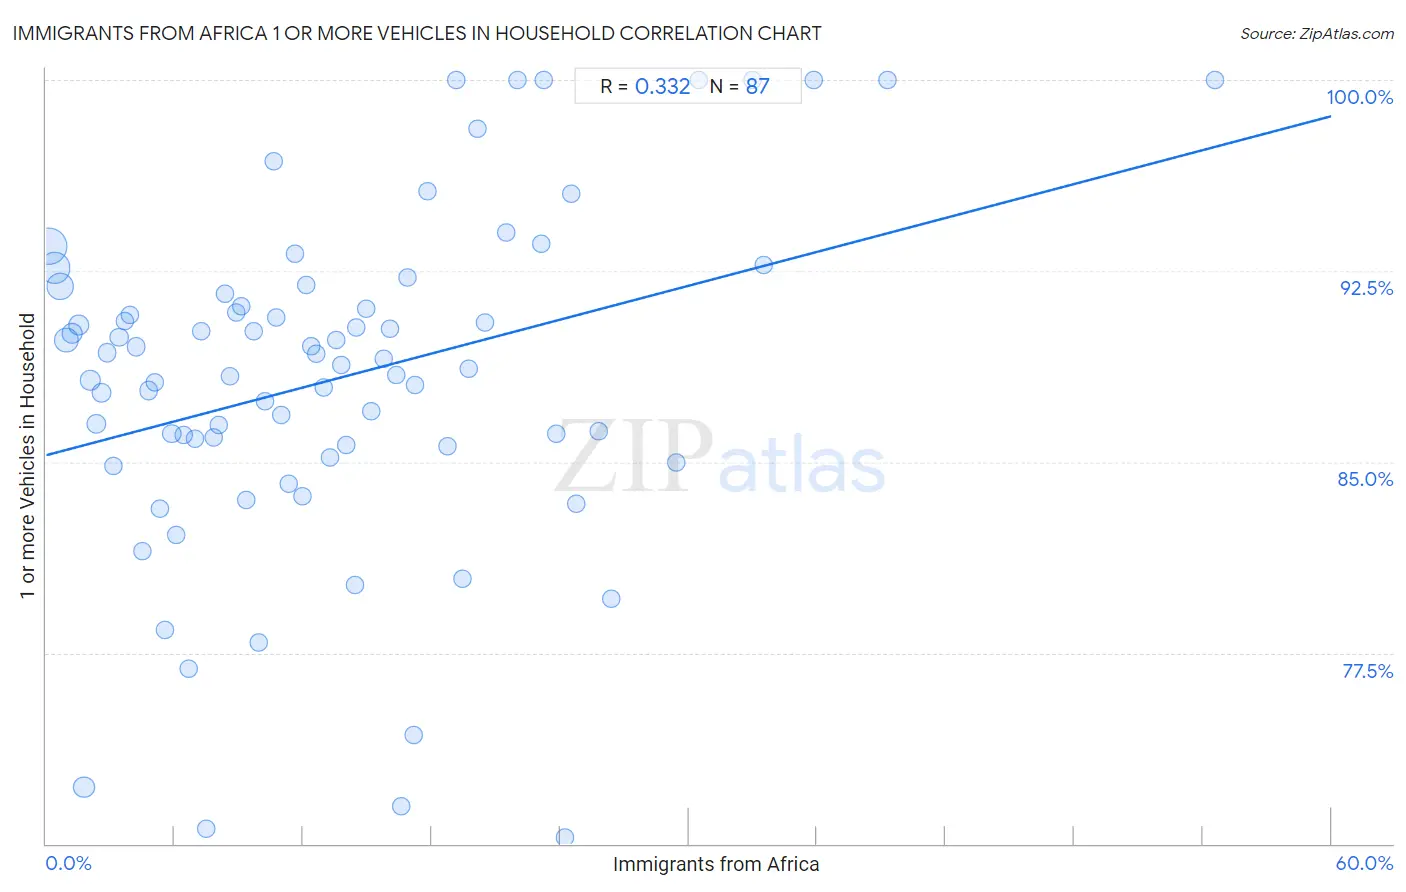
It is essential to understand that the correlation between the percentage of Immigrants from Africa and percentage of households with 1 or more vehicles available does not imply a direct cause-and-effect relationship. It remains uncertain whether the presence of Immigrants from Africa influences an upward or downward trend in the level of percentage of households with 1 or more vehicles available within an area, or if Immigrants from Africa simply ended up residing in those areas with higher or lower levels of percentage of households with 1 or more vehicles available due to other factors.
Demographics Similar to Immigrants from Africa by 1 or more Vehicles in Household
In terms of 1 or more vehicles in household, the demographic groups most similar to Immigrants from Africa are Panamanian (87.5%, a difference of 0.010%), Bermudan (87.5%, a difference of 0.020%), Immigrants from Europe (87.6%, a difference of 0.050%), Immigrants from Colombia (87.6%, a difference of 0.080%), and Aleut (87.5%, a difference of 0.080%).
| Demographics | Rating | Rank | 1 or more Vehicles in Household |
| Sub-Saharan Africans | 0.5 /100 | #262 | Tragic 87.9% |
| Immigrants from Egypt | 0.5 /100 | #263 | Tragic 87.8% |
| Immigrants from Liberia | 0.4 /100 | #264 | Tragic 87.8% |
| Africans | 0.4 /100 | #265 | Tragic 87.8% |
| Israelis | 0.3 /100 | #266 | Tragic 87.7% |
| Immigrants from Colombia | 0.3 /100 | #267 | Tragic 87.6% |
| Immigrants from Europe | 0.2 /100 | #268 | Tragic 87.6% |
| Immigrants from Africa | 0.2 /100 | #269 | Tragic 87.6% |
| Panamanians | 0.2 /100 | #270 | Tragic 87.5% |
| Bermudans | 0.2 /100 | #271 | Tragic 87.5% |
| Aleuts | 0.2 /100 | #272 | Tragic 87.5% |
| Immigrants from Northern Africa | 0.2 /100 | #273 | Tragic 87.4% |
| Immigrants from Morocco | 0.1 /100 | #274 | Tragic 87.4% |
| Immigrants from Singapore | 0.1 /100 | #275 | Tragic 87.2% |
| Immigrants from France | 0.1 /100 | #276 | Tragic 87.1% |
Immigrants from Africa 1 or more Vehicles in Household Correlation Summary
| Measurement | Immigrants from Africa Data | 1 or more Vehicles in Household Data |
| Minimum | 0.13% | 70.3% |
| Maximum | 54.5% | 100.0% |
| Range | 54.4% | 29.7% |
| Mean | 13.5% | 88.3% |
| Median | 11.9% | 88.8% |
| Interquartile 25% (IQ1) | 5.9% | 85.6% |
| Interquartile 75% (IQ3) | 19.2% | 91.6% |
| Interquartile Range (IQR) | 13.3% | 6.0% |
| Standard Deviation (Sample) | 10.0% | 6.7% |
| Standard Deviation (Population) | 9.9% | 6.7% |
Correlation Details
| Immigrants from Africa Percentile | Sample Size | 1 or more Vehicles in Household |
[ 0.0% - 0.5% ] 0.13% | 137,556,980 | 93.5% |
[ 0.0% - 0.5% ] 0.40% | 95,751,862 | 92.6% |
[ 0.5% - 1.0% ] 0.67% | 62,012,598 | 91.9% |
[ 0.5% - 1.0% ] 0.94% | 44,261,605 | 89.8% |
[ 1.0% - 1.5% ] 1.21% | 24,087,195 | 90.0% |
[ 1.0% - 1.5% ] 1.50% | 17,766,000 | 90.4% |
[ 1.5% - 2.0% ] 1.78% | 23,444,689 | 72.2% |
[ 2.0% - 2.5% ] 2.04% | 14,439,967 | 88.2% |
[ 2.0% - 2.5% ] 2.32% | 7,979,189 | 86.5% |
[ 2.5% - 3.0% ] 2.59% | 5,368,647 | 87.7% |
[ 2.5% - 3.0% ] 2.85% | 5,885,791 | 89.3% |
[ 3.0% - 3.5% ] 3.14% | 4,493,997 | 84.8% |
[ 3.0% - 3.5% ] 3.41% | 3,464,318 | 89.9% |
[ 3.5% - 4.0% ] 3.67% | 2,666,688 | 90.5% |
[ 3.5% - 4.0% ] 3.92% | 1,621,288 | 90.8% |
[ 4.0% - 4.5% ] 4.22% | 1,696,609 | 89.5% |
[ 4.0% - 4.5% ] 4.49% | 1,414,744 | 81.5% |
[ 4.5% - 5.0% ] 4.78% | 1,543,817 | 87.8% |
[ 5.0% - 5.5% ] 5.09% | 2,197,397 | 88.1% |
[ 5.0% - 5.5% ] 5.30% | 1,240,142 | 83.2% |
[ 5.5% - 6.0% ] 5.56% | 756,761 | 78.4% |
[ 5.5% - 6.0% ] 5.86% | 1,505,070 | 86.1% |
[ 6.0% - 6.5% ] 6.08% | 791,592 | 82.1% |
[ 6.0% - 6.5% ] 6.40% | 587,650 | 86.1% |
[ 6.5% - 7.0% ] 6.67% | 509,020 | 76.9% |
[ 6.5% - 7.0% ] 6.92% | 548,712 | 85.9% |
[ 7.0% - 7.5% ] 7.23% | 484,039 | 90.1% |
[ 7.0% - 7.5% ] 7.50% | 237,394 | 70.6% |
[ 7.5% - 8.0% ] 7.80% | 464,663 | 86.0% |
[ 8.0% - 8.5% ] 8.05% | 250,560 | 86.5% |
[ 8.0% - 8.5% ] 8.32% | 273,494 | 91.6% |
[ 8.5% - 9.0% ] 8.61% | 226,209 | 88.4% |
[ 8.5% - 9.0% ] 8.88% | 165,878 | 90.9% |
[ 9.0% - 9.5% ] 9.13% | 273,232 | 91.1% |
[ 9.0% - 9.5% ] 9.34% | 175,960 | 83.5% |
[ 9.5% - 10.0% ] 9.71% | 414,213 | 90.1% |
[ 9.5% - 10.0% ] 9.94% | 112,394 | 77.9% |
[ 10.0% - 10.5% ] 10.23% | 200,999 | 87.4% |
[ 10.5% - 11.0% ] 10.60% | 106,915 | 96.8% |
[ 10.5% - 11.0% ] 10.74% | 31,403 | 90.6% |
[ 10.5% - 11.0% ] 10.99% | 219,819 | 86.9% |
[ 11.0% - 11.5% ] 11.33% | 129,038 | 84.2% |
[ 11.5% - 12.0% ] 11.59% | 174,030 | 93.2% |
[ 11.5% - 12.0% ] 11.94% | 47,305 | 83.7% |
[ 12.0% - 12.5% ] 12.12% | 198,710 | 92.0% |
[ 12.0% - 12.5% ] 12.39% | 85,199 | 89.5% |
[ 12.5% - 13.0% ] 12.60% | 31,679 | 89.2% |
[ 12.5% - 13.0% ] 12.94% | 214,064 | 87.9% |
[ 13.0% - 13.5% ] 13.24% | 108,203 | 85.2% |
[ 13.5% - 14.0% ] 13.57% | 152,655 | 89.8% |
[ 13.5% - 14.0% ] 13.77% | 65,413 | 88.8% |
[ 14.0% - 14.5% ] 14.03% | 54,073 | 85.7% |
[ 14.0% - 14.5% ] 14.44% | 2,348 | 80.2% |
[ 14.5% - 15.0% ] 14.50% | 29,687 | 90.3% |
[ 14.5% - 15.0% ] 14.95% | 37,693 | 91.0% |
[ 15.0% - 15.5% ] 15.19% | 30,905 | 87.0% |
[ 15.5% - 16.0% ] 15.75% | 16,076 | 89.0% |
[ 16.0% - 16.5% ] 16.03% | 36,105 | 90.2% |
[ 16.0% - 16.5% ] 16.33% | 72,959 | 88.4% |
[ 16.5% - 17.0% ] 16.59% | 31,151 | 71.5% |
[ 16.5% - 17.0% ] 16.87% | 26,071 | 92.3% |
[ 17.0% - 17.5% ] 17.14% | 3,588 | 74.2% |
[ 17.0% - 17.5% ] 17.20% | 56,532 | 88.0% |
[ 17.5% - 18.0% ] 17.78% | 27,919 | 95.6% |
[ 18.5% - 19.0% ] 18.73% | 19,999 | 85.6% |
[ 19.0% - 19.5% ] 19.16% | 981 | 100.0% |
[ 19.0% - 19.5% ] 19.41% | 304 | 80.4% |
[ 19.5% - 20.0% ] 19.71% | 13,580 | 88.6% |
[ 20.0% - 20.5% ] 20.12% | 825 | 98.1% |
[ 20.0% - 20.5% ] 20.48% | 332 | 90.5% |
[ 21.0% - 21.5% ] 21.47% | 8,290 | 94.0% |
[ 22.0% - 22.5% ] 22.01% | 309 | 100.0% |
[ 23.0% - 23.5% ] 23.11% | 7,703 | 93.6% |
[ 23.0% - 23.5% ] 23.22% | 267 | 100.0% |
[ 23.5% - 24.0% ] 23.82% | 14,696 | 86.1% |
[ 24.0% - 24.5% ] 24.22% | 2,849 | 70.3% |
[ 24.5% - 25.0% ] 24.51% | 5,011 | 95.5% |
[ 24.5% - 25.0% ] 24.74% | 97 | 83.3% |
[ 25.5% - 26.0% ] 25.78% | 26,762 | 86.2% |
[ 26.0% - 26.5% ] 26.36% | 1,157 | 79.6% |
[ 29.0% - 29.5% ] 29.42% | 15,489 | 85.0% |
[ 30.0% - 30.5% ] 30.48% | 105 | 100.0% |
[ 32.5% - 33.0% ] 32.97% | 182 | 100.0% |
[ 33.0% - 33.5% ] 33.48% | 699 | 92.7% |
[ 35.5% - 36.0% ] 35.82% | 67 | 100.0% |
[ 39.0% - 39.5% ] 39.29% | 56 | 100.0% |
[ 54.5% - 55.0% ] 54.55% | 11 | 100.0% |