Immigrants from Africa Self-Care Disability
COMPARE
Immigrants from Africa
Select to Compare
Self-Care Disability
Immigrants from Africa Self-Care Disability
2.4%
SELF-CARE DISABILITY
93.7/ 100
METRIC RATING
110th/ 347
METRIC RANK
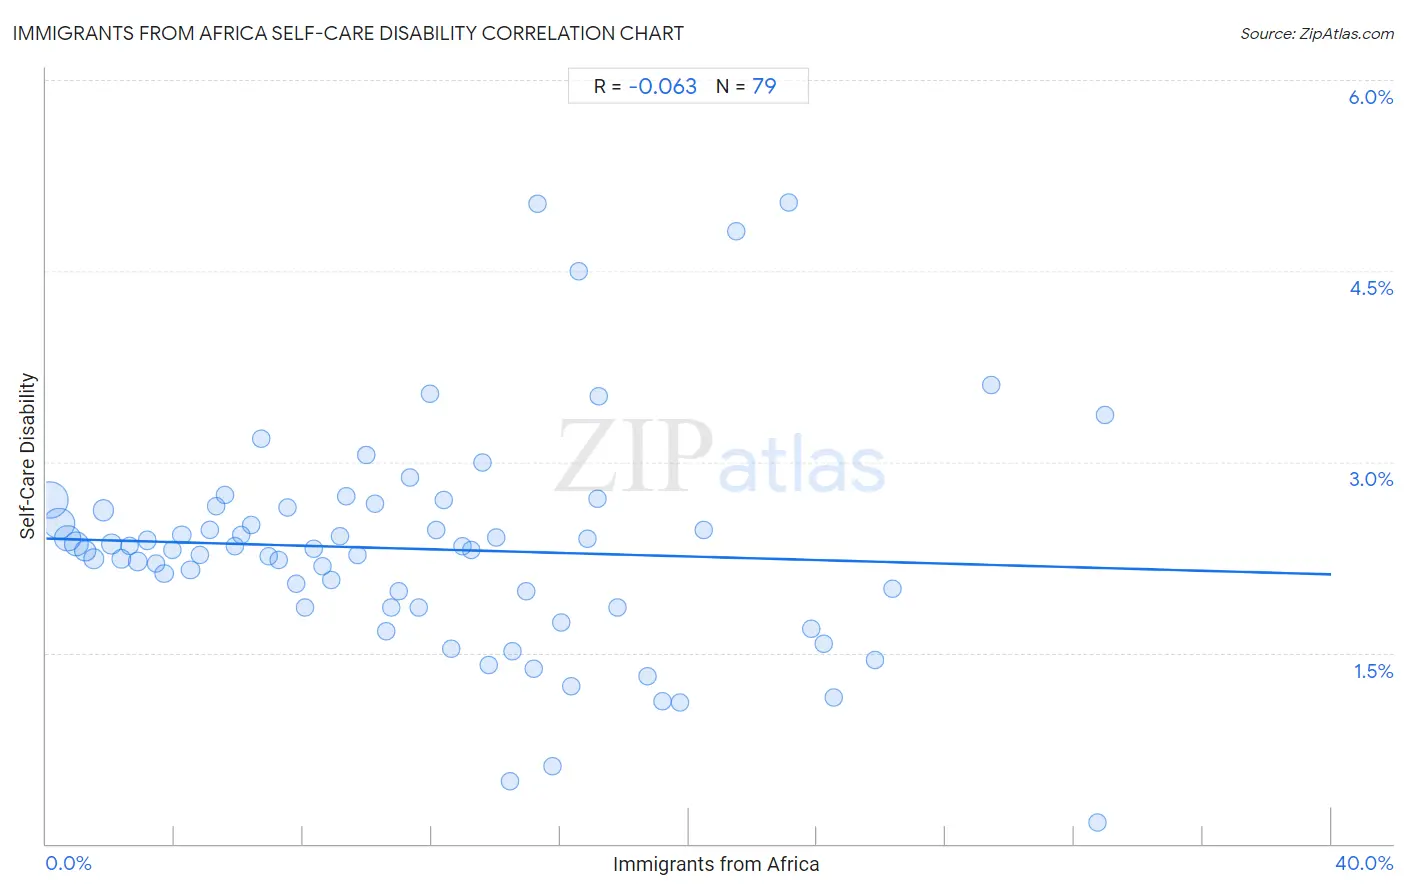
Immigrants from Africa Self-Care Disability Correlation Chart
The statistical analysis conducted on geographies consisting of 468,498,120 people shows a slight negative correlation between the proportion of Immigrants from Africa and percentage of population with self-care disability in the United States with a correlation coefficient (R) of -0.063 and weighted average of 2.4%. On average, for every 1% (one percent) increase in Immigrants from Africa within a typical geography, there is a decrease of 0.0070% in percentage of population with self-care disability.
It is essential to understand that the correlation between the percentage of Immigrants from Africa and percentage of population with self-care disability does not imply a direct cause-and-effect relationship. It remains uncertain whether the presence of Immigrants from Africa influences an upward or downward trend in the level of percentage of population with self-care disability within an area, or if Immigrants from Africa simply ended up residing in those areas with higher or lower levels of percentage of population with self-care disability due to other factors.
Demographics Similar to Immigrants from Africa by Self-Care Disability
In terms of self-care disability, the demographic groups most similar to Immigrants from Africa are Serbian (2.4%, a difference of 0.020%), Scandinavian (2.4%, a difference of 0.050%), Slovene (2.4%, a difference of 0.080%), Greek (2.4%, a difference of 0.090%), and South American (2.4%, a difference of 0.11%).
| Demographics | Rating | Rank | Self-Care Disability |
| Alsatians | 94.9 /100 | #103 | Exceptional 2.4% |
| Bhutanese | 94.5 /100 | #104 | Exceptional 2.4% |
| Carpatho Rusyns | 94.4 /100 | #105 | Exceptional 2.4% |
| Immigrants from Indonesia | 94.3 /100 | #106 | Exceptional 2.4% |
| British | 94.3 /100 | #107 | Exceptional 2.4% |
| Greeks | 94.1 /100 | #108 | Exceptional 2.4% |
| Slovenes | 94.1 /100 | #109 | Exceptional 2.4% |
| Immigrants from Africa | 93.7 /100 | #110 | Exceptional 2.4% |
| Serbians | 93.6 /100 | #111 | Exceptional 2.4% |
| Scandinavians | 93.5 /100 | #112 | Exceptional 2.4% |
| South Americans | 93.2 /100 | #113 | Exceptional 2.4% |
| Immigrants from North Macedonia | 93.1 /100 | #114 | Exceptional 2.4% |
| Immigrants from Hong Kong | 93.1 /100 | #115 | Exceptional 2.4% |
| Northern Europeans | 92.9 /100 | #116 | Exceptional 2.4% |
| Taiwanese | 92.5 /100 | #117 | Exceptional 2.4% |
Immigrants from Africa Self-Care Disability Correlation Summary
| Measurement | Immigrants from Africa Data | Self-Care Disability Data |
| Minimum | 0.13% | 0.17% |
| Maximum | 33.0% | 5.0% |
| Range | 32.8% | 4.9% |
| Mean | 11.6% | 2.3% |
| Median | 10.7% | 2.3% |
| Interquartile 25% (IQ1) | 5.3% | 1.9% |
| Interquartile 75% (IQ3) | 16.3% | 2.6% |
| Interquartile Range (IQR) | 11.0% | 0.79% |
| Standard Deviation (Sample) | 7.8% | 0.87% |
| Standard Deviation (Population) | 7.8% | 0.87% |
Correlation Details
| Immigrants from Africa Percentile | Sample Size | Self-Care Disability |
[ 0.0% - 0.5% ] 0.13% | 137,430,879 | 2.7% |
[ 0.0% - 0.5% ] 0.40% | 95,653,061 | 2.5% |
[ 0.5% - 1.0% ] 0.67% | 61,950,673 | 2.4% |
[ 0.5% - 1.0% ] 0.94% | 44,216,333 | 2.4% |
[ 1.0% - 1.5% ] 1.21% | 24,047,132 | 2.3% |
[ 1.0% - 1.5% ] 1.50% | 17,753,671 | 2.2% |
[ 1.5% - 2.0% ] 1.78% | 23,413,069 | 2.6% |
[ 2.0% - 2.5% ] 2.04% | 14,431,319 | 2.4% |
[ 2.0% - 2.5% ] 2.32% | 7,948,202 | 2.2% |
[ 2.5% - 3.0% ] 2.59% | 5,365,831 | 2.3% |
[ 2.5% - 3.0% ] 2.85% | 5,876,334 | 2.2% |
[ 3.0% - 3.5% ] 3.14% | 4,493,345 | 2.4% |
[ 3.0% - 3.5% ] 3.41% | 3,460,650 | 2.2% |
[ 3.5% - 4.0% ] 3.67% | 2,663,486 | 2.1% |
[ 3.5% - 4.0% ] 3.92% | 1,613,219 | 2.3% |
[ 4.0% - 4.5% ] 4.22% | 1,692,181 | 2.4% |
[ 4.0% - 4.5% ] 4.49% | 1,411,203 | 2.1% |
[ 4.5% - 5.0% ] 4.78% | 1,543,649 | 2.3% |
[ 5.0% - 5.5% ] 5.09% | 2,197,073 | 2.5% |
[ 5.0% - 5.5% ] 5.30% | 1,238,936 | 2.7% |
[ 5.5% - 6.0% ] 5.56% | 754,444 | 2.7% |
[ 5.5% - 6.0% ] 5.86% | 1,503,696 | 2.3% |
[ 6.0% - 6.5% ] 6.08% | 790,762 | 2.4% |
[ 6.0% - 6.5% ] 6.40% | 584,661 | 2.5% |
[ 6.5% - 7.0% ] 6.67% | 508,858 | 3.2% |
[ 6.5% - 7.0% ] 6.92% | 548,325 | 2.3% |
[ 7.0% - 7.5% ] 7.23% | 484,039 | 2.2% |
[ 7.0% - 7.5% ] 7.50% | 240,984 | 2.6% |
[ 7.5% - 8.0% ] 7.80% | 463,465 | 2.0% |
[ 8.0% - 8.5% ] 8.05% | 249,770 | 1.9% |
[ 8.0% - 8.5% ] 8.32% | 272,744 | 2.3% |
[ 8.5% - 9.0% ] 8.61% | 226,047 | 2.2% |
[ 8.5% - 9.0% ] 8.88% | 164,459 | 2.1% |
[ 9.0% - 9.5% ] 9.13% | 270,876 | 2.4% |
[ 9.0% - 9.5% ] 9.34% | 175,960 | 2.7% |
[ 9.5% - 10.0% ] 9.71% | 414,213 | 2.3% |
[ 9.5% - 10.0% ] 9.94% | 112,394 | 3.1% |
[ 10.0% - 10.5% ] 10.23% | 201,508 | 2.7% |
[ 10.5% - 11.0% ] 10.60% | 106,284 | 1.7% |
[ 10.5% - 11.0% ] 10.74% | 31,403 | 1.9% |
[ 10.5% - 11.0% ] 10.99% | 219,819 | 2.0% |
[ 11.0% - 11.5% ] 11.33% | 128,695 | 2.9% |
[ 11.5% - 12.0% ] 11.59% | 173,608 | 1.9% |
[ 11.5% - 12.0% ] 11.94% | 47,305 | 3.5% |
[ 12.0% - 12.5% ] 12.12% | 198,710 | 2.5% |
[ 12.0% - 12.5% ] 12.39% | 85,199 | 2.7% |
[ 12.5% - 13.0% ] 12.60% | 31,679 | 1.5% |
[ 12.5% - 13.0% ] 12.94% | 211,069 | 2.3% |
[ 13.0% - 13.5% ] 13.24% | 107,661 | 2.3% |
[ 13.5% - 14.0% ] 13.57% | 152,402 | 3.0% |
[ 13.5% - 14.0% ] 13.77% | 65,413 | 1.4% |
[ 14.0% - 14.5% ] 14.03% | 54,073 | 2.4% |
[ 14.0% - 14.5% ] 14.44% | 2,348 | 0.50% |
[ 14.5% - 15.0% ] 14.50% | 29,687 | 1.5% |
[ 14.5% - 15.0% ] 14.95% | 37,693 | 2.0% |
[ 15.0% - 15.5% ] 15.19% | 30,905 | 1.4% |
[ 15.0% - 15.5% ] 15.29% | 29,830 | 5.0% |
[ 15.5% - 16.0% ] 15.75% | 16,076 | 0.61% |
[ 16.0% - 16.5% ] 16.03% | 36,105 | 1.7% |
[ 16.0% - 16.5% ] 16.33% | 72,959 | 1.2% |
[ 16.5% - 17.0% ] 16.59% | 31,151 | 4.5% |
[ 16.5% - 17.0% ] 16.87% | 25,987 | 2.4% |
[ 17.0% - 17.5% ] 17.15% | 3,056 | 2.7% |
[ 17.0% - 17.5% ] 17.20% | 56,532 | 3.5% |
[ 17.5% - 18.0% ] 17.78% | 27,919 | 1.9% |
[ 18.5% - 19.0% ] 18.73% | 19,999 | 1.3% |
[ 19.0% - 19.5% ] 19.16% | 981 | 1.1% |
[ 19.5% - 20.0% ] 19.71% | 13,580 | 1.1% |
[ 20.0% - 20.5% ] 20.48% | 332 | 2.5% |
[ 21.0% - 21.5% ] 21.47% | 8,290 | 4.8% |
[ 23.0% - 23.5% ] 23.11% | 7,703 | 5.0% |
[ 23.5% - 24.0% ] 23.82% | 14,696 | 1.7% |
[ 24.0% - 24.5% ] 24.22% | 2,849 | 1.6% |
[ 24.5% - 25.0% ] 24.52% | 4,572 | 1.1% |
[ 25.5% - 26.0% ] 25.78% | 26,684 | 1.4% |
[ 26.0% - 26.5% ] 26.36% | 1,157 | 2.0% |
[ 29.0% - 29.5% ] 29.42% | 15,489 | 3.6% |
[ 32.5% - 33.0% ] 32.71% | 587 | 0.17% |
[ 32.5% - 33.0% ] 32.97% | 182 | 3.4% |