Immigrants from Africa Disability
COMPARE
Immigrants from Africa
Select to Compare
Disability
Immigrants from Africa Disability
11.4%
DISABILITY
89.3/ 100
METRIC RATING
132nd/ 347
METRIC RANK
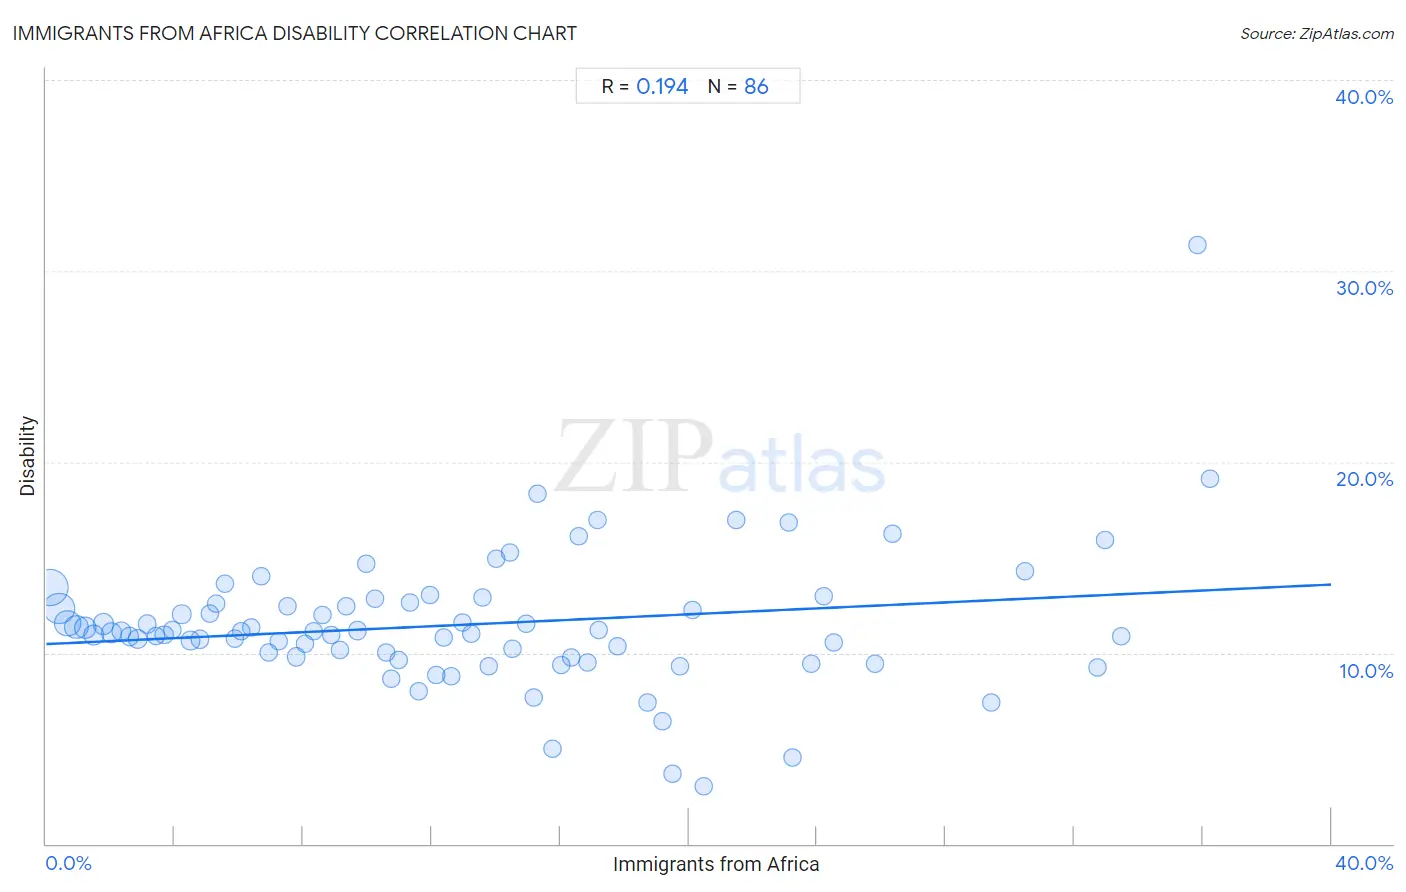
Immigrants from Africa Disability Correlation Chart
The statistical analysis conducted on geographies consisting of 469,357,699 people shows a poor positive correlation between the proportion of Immigrants from Africa and percentage of population with a disability in the United States with a correlation coefficient (R) of 0.194 and weighted average of 11.4%. On average, for every 1% (one percent) increase in Immigrants from Africa within a typical geography, there is an increase of 0.078% in percentage of population with a disability.
It is essential to understand that the correlation between the percentage of Immigrants from Africa and percentage of population with a disability does not imply a direct cause-and-effect relationship. It remains uncertain whether the presence of Immigrants from Africa influences an upward or downward trend in the level of percentage of population with a disability within an area, or if Immigrants from Africa simply ended up residing in those areas with higher or lower levels of percentage of population with a disability due to other factors.
Demographics Similar to Immigrants from Africa by Disability
In terms of disability, the demographic groups most similar to Immigrants from Africa are Arab (11.4%, a difference of 0.030%), Immigrants from Croatia (11.4%, a difference of 0.060%), Latvian (11.4%, a difference of 0.070%), Immigrants from Guyana (11.4%, a difference of 0.11%), and Macedonian (11.4%, a difference of 0.12%).
| Demographics | Rating | Rank | Disability |
| Costa Ricans | 91.9 /100 | #125 | Exceptional 11.4% |
| Immigrants from Latvia | 90.9 /100 | #126 | Exceptional 11.4% |
| Immigrants from Italy | 90.4 /100 | #127 | Exceptional 11.4% |
| Immigrants from Europe | 90.4 /100 | #128 | Exceptional 11.4% |
| Macedonians | 90.3 /100 | #129 | Exceptional 11.4% |
| Latvians | 89.8 /100 | #130 | Excellent 11.4% |
| Immigrants from Croatia | 89.8 /100 | #131 | Excellent 11.4% |
| Immigrants from Africa | 89.3 /100 | #132 | Excellent 11.4% |
| Arabs | 89.1 /100 | #133 | Excellent 11.4% |
| Immigrants from Guyana | 88.3 /100 | #134 | Excellent 11.4% |
| Ugandans | 87.9 /100 | #135 | Excellent 11.4% |
| Immigrants from St. Vincent and the Grenadines | 87.8 /100 | #136 | Excellent 11.4% |
| Kenyans | 87.1 /100 | #137 | Excellent 11.5% |
| New Zealanders | 87.0 /100 | #138 | Excellent 11.5% |
| Ghanaians | 87.0 /100 | #139 | Excellent 11.5% |
Immigrants from Africa Disability Correlation Summary
| Measurement | Immigrants from Africa Data | Disability Data |
| Minimum | 0.13% | 3.0% |
| Maximum | 36.2% | 31.3% |
| Range | 36.1% | 28.3% |
| Mean | 13.0% | 11.5% |
| Median | 11.8% | 11.1% |
| Interquartile 25% (IQ1) | 5.9% | 9.8% |
| Interquartile 75% (IQ3) | 17.8% | 12.6% |
| Interquartile Range (IQR) | 11.9% | 2.8% |
| Standard Deviation (Sample) | 9.0% | 3.6% |
| Standard Deviation (Population) | 9.0% | 3.6% |
Correlation Details
| Immigrants from Africa Percentile | Sample Size | Disability |
[ 0.0% - 0.5% ] 0.13% | 137,614,450 | 13.4% |
[ 0.0% - 0.5% ] 0.40% | 95,845,779 | 12.3% |
[ 0.5% - 1.0% ] 0.67% | 62,071,759 | 11.6% |
[ 0.5% - 1.0% ] 0.94% | 44,289,513 | 11.4% |
[ 1.0% - 1.5% ] 1.21% | 24,109,631 | 11.3% |
[ 1.0% - 1.5% ] 1.50% | 17,793,526 | 10.9% |
[ 1.5% - 2.0% ] 1.78% | 23,455,031 | 11.5% |
[ 2.0% - 2.5% ] 2.04% | 14,454,179 | 11.0% |
[ 2.0% - 2.5% ] 2.32% | 7,982,244 | 11.1% |
[ 2.5% - 3.0% ] 2.59% | 5,372,753 | 10.8% |
[ 2.5% - 3.0% ] 2.85% | 5,885,127 | 10.7% |
[ 3.0% - 3.5% ] 3.14% | 4,497,036 | 11.5% |
[ 3.0% - 3.5% ] 3.41% | 3,467,034 | 10.9% |
[ 3.5% - 4.0% ] 3.67% | 2,667,304 | 10.9% |
[ 3.5% - 4.0% ] 3.92% | 1,622,254 | 11.2% |
[ 4.0% - 4.5% ] 4.22% | 1,699,507 | 12.0% |
[ 4.0% - 4.5% ] 4.49% | 1,414,744 | 10.6% |
[ 4.5% - 5.0% ] 4.78% | 1,544,067 | 10.7% |
[ 5.0% - 5.5% ] 5.09% | 2,197,397 | 12.1% |
[ 5.0% - 5.5% ] 5.30% | 1,240,927 | 12.6% |
[ 5.5% - 6.0% ] 5.56% | 756,761 | 13.6% |
[ 5.5% - 6.0% ] 5.86% | 1,505,070 | 10.7% |
[ 6.0% - 6.5% ] 6.08% | 791,592 | 11.1% |
[ 6.0% - 6.5% ] 6.40% | 587,650 | 11.3% |
[ 6.5% - 7.0% ] 6.67% | 509,020 | 14.0% |
[ 6.5% - 7.0% ] 6.92% | 550,889 | 10.0% |
[ 7.0% - 7.5% ] 7.23% | 484,039 | 10.6% |
[ 7.0% - 7.5% ] 7.50% | 242,000 | 12.5% |
[ 7.5% - 8.0% ] 7.80% | 464,663 | 9.8% |
[ 8.0% - 8.5% ] 8.05% | 250,560 | 10.5% |
[ 8.0% - 8.5% ] 8.32% | 273,494 | 11.1% |
[ 8.5% - 9.0% ] 8.61% | 226,209 | 12.0% |
[ 8.5% - 9.0% ] 8.88% | 165,878 | 11.0% |
[ 9.0% - 9.5% ] 9.13% | 273,232 | 10.1% |
[ 9.0% - 9.5% ] 9.34% | 175,960 | 12.4% |
[ 9.5% - 10.0% ] 9.71% | 414,213 | 11.2% |
[ 9.5% - 10.0% ] 9.94% | 112,394 | 14.7% |
[ 10.0% - 10.5% ] 10.23% | 201,508 | 12.9% |
[ 10.5% - 11.0% ] 10.60% | 106,915 | 10.0% |
[ 10.5% - 11.0% ] 10.74% | 31,403 | 8.6% |
[ 10.5% - 11.0% ] 10.99% | 220,869 | 9.6% |
[ 11.0% - 11.5% ] 11.33% | 129,038 | 12.6% |
[ 11.5% - 12.0% ] 11.59% | 173,608 | 8.0% |
[ 11.5% - 12.0% ] 11.94% | 47,305 | 13.0% |
[ 12.0% - 12.5% ] 12.12% | 198,710 | 8.8% |
[ 12.0% - 12.5% ] 12.39% | 85,199 | 10.8% |
[ 12.5% - 13.0% ] 12.60% | 31,679 | 8.8% |
[ 12.5% - 13.0% ] 12.94% | 214,064 | 11.6% |
[ 13.0% - 13.5% ] 13.24% | 108,203 | 11.0% |
[ 13.5% - 14.0% ] 13.57% | 152,655 | 12.9% |
[ 13.5% - 14.0% ] 13.77% | 65,413 | 9.3% |
[ 14.0% - 14.5% ] 14.03% | 54,073 | 14.9% |
[ 14.0% - 14.5% ] 14.44% | 2,348 | 15.2% |
[ 14.5% - 15.0% ] 14.50% | 29,687 | 10.2% |
[ 14.5% - 15.0% ] 14.95% | 37,693 | 11.5% |
[ 15.0% - 15.5% ] 15.19% | 30,905 | 7.6% |
[ 15.0% - 15.5% ] 15.29% | 29,830 | 18.3% |
[ 15.5% - 16.0% ] 15.75% | 16,076 | 5.0% |
[ 16.0% - 16.5% ] 16.03% | 36,105 | 9.4% |
[ 16.0% - 16.5% ] 16.33% | 72,959 | 9.8% |
[ 16.5% - 17.0% ] 16.59% | 31,151 | 16.1% |
[ 16.5% - 17.0% ] 16.87% | 26,035 | 9.5% |
[ 17.0% - 17.5% ] 17.14% | 3,588 | 16.9% |
[ 17.0% - 17.5% ] 17.20% | 56,532 | 11.2% |
[ 17.5% - 18.0% ] 17.78% | 27,919 | 10.3% |
[ 18.5% - 19.0% ] 18.73% | 19,999 | 7.4% |
[ 19.0% - 19.5% ] 19.16% | 981 | 6.4% |
[ 19.5% - 20.0% ] 19.51% | 82 | 3.7% |
[ 19.5% - 20.0% ] 19.71% | 13,580 | 9.3% |
[ 20.0% - 20.5% ] 20.12% | 825 | 12.2% |
[ 20.0% - 20.5% ] 20.48% | 332 | 3.0% |
[ 21.0% - 21.5% ] 21.47% | 8,290 | 16.9% |
[ 23.0% - 23.5% ] 23.11% | 7,703 | 16.8% |
[ 23.0% - 23.5% ] 23.22% | 267 | 4.5% |
[ 23.5% - 24.0% ] 23.82% | 14,696 | 9.5% |
[ 24.0% - 24.5% ] 24.22% | 2,849 | 13.0% |
[ 24.5% - 25.0% ] 24.51% | 5,011 | 10.6% |
[ 25.5% - 26.0% ] 25.78% | 26,762 | 9.4% |
[ 26.0% - 26.5% ] 26.36% | 1,157 | 16.2% |
[ 29.0% - 29.5% ] 29.42% | 15,489 | 7.4% |
[ 30.0% - 30.5% ] 30.48% | 105 | 14.3% |
[ 32.5% - 33.0% ] 32.71% | 587 | 9.2% |
[ 32.5% - 33.0% ] 32.97% | 182 | 15.9% |
[ 33.0% - 33.5% ] 33.47% | 487 | 10.9% |
[ 35.5% - 36.0% ] 35.82% | 67 | 31.3% |
[ 36.0% - 36.5% ] 36.22% | 8,892 | 19.1% |