Immigrants from Africa Married-couple Households
COMPARE
Immigrants from Africa
Select to Compare
Married-couple Households
Immigrants from Africa Married-couple Households
42.9%
MARRIED-COUPLE HOUSEHOLDS
0.0/ 100
METRIC RATING
278th/ 347
METRIC RANK
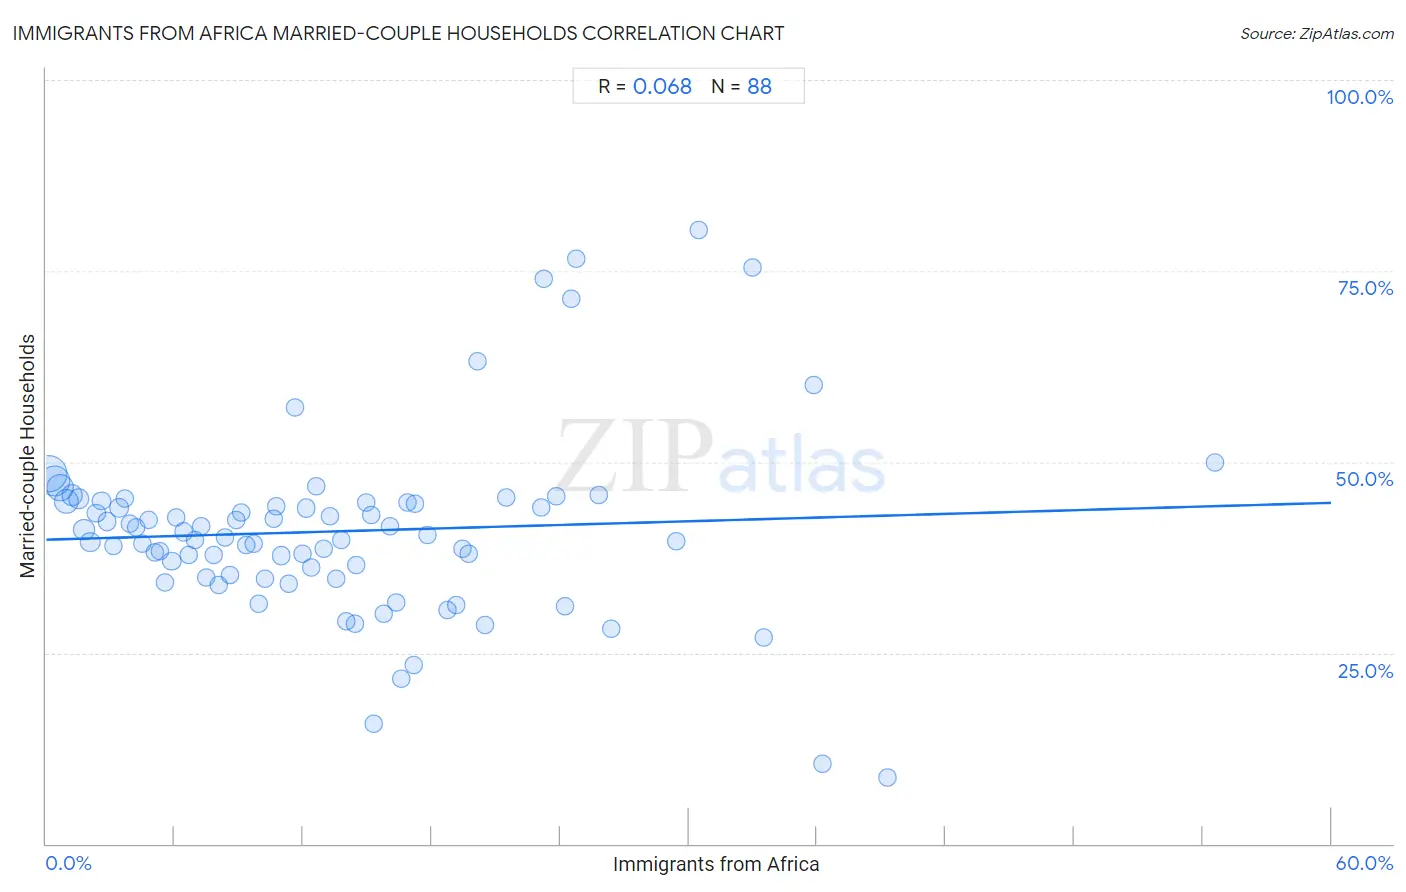
Immigrants from Africa Married-couple Households Correlation Chart
The statistical analysis conducted on geographies consisting of 468,925,641 people shows a slight positive correlation between the proportion of Immigrants from Africa and percentage of married-couple family households in the United States with a correlation coefficient (R) of 0.068 and weighted average of 42.9%. On average, for every 1% (one percent) increase in Immigrants from Africa within a typical geography, there is an increase of 0.081% in percentage of married-couple family households.
It is essential to understand that the correlation between the percentage of Immigrants from Africa and percentage of married-couple family households does not imply a direct cause-and-effect relationship. It remains uncertain whether the presence of Immigrants from Africa influences an upward or downward trend in the level of percentage of married-couple family households within an area, or if Immigrants from Africa simply ended up residing in those areas with higher or lower levels of percentage of married-couple family households due to other factors.
Demographics Similar to Immigrants from Africa by Married-couple Households
In terms of married-couple households, the demographic groups most similar to Immigrants from Africa are Sierra Leonean (42.9%, a difference of 0.030%), Immigrants from Ecuador (42.9%, a difference of 0.080%), Immigrants from Eastern Africa (42.9%, a difference of 0.11%), Immigrants from Guatemala (42.8%, a difference of 0.16%), and Immigrants from Ethiopia (43.1%, a difference of 0.36%).
| Demographics | Rating | Rank | Married-couple Households |
| Guatemalans | 0.1 /100 | #271 | Tragic 43.3% |
| Immigrants from Nigeria | 0.1 /100 | #272 | Tragic 43.2% |
| Ethiopians | 0.1 /100 | #273 | Tragic 43.2% |
| Nigerians | 0.1 /100 | #274 | Tragic 43.2% |
| Immigrants from Bangladesh | 0.0 /100 | #275 | Tragic 43.1% |
| Immigrants from Ethiopia | 0.0 /100 | #276 | Tragic 43.1% |
| Immigrants from Eastern Africa | 0.0 /100 | #277 | Tragic 42.9% |
| Immigrants from Africa | 0.0 /100 | #278 | Tragic 42.9% |
| Sierra Leoneans | 0.0 /100 | #279 | Tragic 42.9% |
| Immigrants from Ecuador | 0.0 /100 | #280 | Tragic 42.9% |
| Immigrants from Guatemala | 0.0 /100 | #281 | Tragic 42.8% |
| Bermudans | 0.0 /100 | #282 | Tragic 42.4% |
| Inupiat | 0.0 /100 | #283 | Tragic 42.4% |
| Cheyenne | 0.0 /100 | #284 | Tragic 42.3% |
| Ghanaians | 0.0 /100 | #285 | Tragic 42.2% |
Immigrants from Africa Married-couple Households Correlation Summary
| Measurement | Immigrants from Africa Data | Married-couple Households Data |
| Minimum | 0.13% | 8.7% |
| Maximum | 54.5% | 80.4% |
| Range | 54.4% | 71.7% |
| Mean | 13.7% | 40.9% |
| Median | 12.0% | 40.3% |
| Interquartile 25% (IQ1) | 6.0% | 35.0% |
| Interquartile 75% (IQ3) | 18.9% | 44.7% |
| Interquartile Range (IQR) | 13.0% | 9.7% |
| Standard Deviation (Sample) | 10.2% | 12.1% |
| Standard Deviation (Population) | 10.1% | 12.1% |
Correlation Details
| Immigrants from Africa Percentile | Sample Size | Married-couple Households |
[ 0.0% - 0.5% ] 0.13% | 137,526,106 | 48.4% |
[ 0.0% - 0.5% ] 0.40% | 95,736,940 | 47.5% |
[ 0.5% - 1.0% ] 0.67% | 62,000,718 | 46.6% |
[ 0.5% - 1.0% ] 0.94% | 44,240,140 | 44.8% |
[ 1.0% - 1.5% ] 1.21% | 24,087,195 | 45.7% |
[ 1.0% - 1.5% ] 1.50% | 17,765,418 | 45.1% |
[ 1.5% - 2.0% ] 1.78% | 23,438,934 | 41.1% |
[ 2.0% - 2.5% ] 2.04% | 14,436,445 | 39.5% |
[ 2.0% - 2.5% ] 2.32% | 7,979,189 | 43.3% |
[ 2.5% - 3.0% ] 2.59% | 5,369,511 | 44.9% |
[ 2.5% - 3.0% ] 2.85% | 5,885,791 | 42.2% |
[ 3.0% - 3.5% ] 3.14% | 4,493,997 | 39.0% |
[ 3.0% - 3.5% ] 3.41% | 3,463,959 | 43.9% |
[ 3.5% - 4.0% ] 3.67% | 2,666,470 | 45.1% |
[ 3.5% - 4.0% ] 3.92% | 1,620,646 | 41.9% |
[ 4.0% - 4.5% ] 4.22% | 1,694,685 | 41.4% |
[ 4.0% - 4.5% ] 4.49% | 1,414,744 | 39.3% |
[ 4.5% - 5.0% ] 4.78% | 1,543,817 | 42.4% |
[ 5.0% - 5.5% ] 5.09% | 2,197,073 | 38.2% |
[ 5.0% - 5.5% ] 5.30% | 1,240,142 | 38.4% |
[ 5.5% - 6.0% ] 5.56% | 756,761 | 34.1% |
[ 5.5% - 6.0% ] 5.86% | 1,503,999 | 37.0% |
[ 6.0% - 6.5% ] 6.08% | 791,592 | 42.7% |
[ 6.0% - 6.5% ] 6.40% | 587,650 | 40.8% |
[ 6.5% - 7.0% ] 6.67% | 509,020 | 37.8% |
[ 6.5% - 7.0% ] 6.92% | 548,712 | 39.7% |
[ 7.0% - 7.5% ] 7.23% | 484,039 | 41.5% |
[ 7.0% - 7.5% ] 7.50% | 237,394 | 34.8% |
[ 7.5% - 8.0% ] 7.80% | 464,663 | 37.9% |
[ 8.0% - 8.5% ] 8.05% | 249,770 | 33.8% |
[ 8.0% - 8.5% ] 8.32% | 273,494 | 40.2% |
[ 8.5% - 9.0% ] 8.61% | 226,209 | 35.2% |
[ 8.5% - 9.0% ] 8.88% | 165,878 | 42.5% |
[ 9.0% - 9.5% ] 9.13% | 273,232 | 43.4% |
[ 9.0% - 9.5% ] 9.34% | 175,960 | 39.1% |
[ 9.5% - 10.0% ] 9.71% | 414,213 | 39.3% |
[ 9.5% - 10.0% ] 9.94% | 112,394 | 31.5% |
[ 10.0% - 10.5% ] 10.23% | 200,999 | 34.6% |
[ 10.5% - 11.0% ] 10.60% | 106,915 | 42.5% |
[ 10.5% - 11.0% ] 10.74% | 31,403 | 44.3% |
[ 10.5% - 11.0% ] 10.99% | 219,819 | 37.7% |
[ 11.0% - 11.5% ] 11.33% | 129,038 | 34.1% |
[ 11.5% - 12.0% ] 11.59% | 174,030 | 57.1% |
[ 11.5% - 12.0% ] 11.94% | 47,305 | 37.9% |
[ 12.0% - 12.5% ] 12.12% | 198,710 | 43.9% |
[ 12.0% - 12.5% ] 12.39% | 85,199 | 36.2% |
[ 12.5% - 13.0% ] 12.60% | 31,679 | 46.9% |
[ 12.5% - 13.0% ] 12.94% | 214,064 | 38.6% |
[ 13.0% - 13.5% ] 13.24% | 108,203 | 42.9% |
[ 13.5% - 14.0% ] 13.57% | 152,655 | 34.7% |
[ 13.5% - 14.0% ] 13.77% | 65,413 | 39.8% |
[ 14.0% - 14.5% ] 14.03% | 54,073 | 29.1% |
[ 14.0% - 14.5% ] 14.44% | 2,348 | 28.8% |
[ 14.5% - 15.0% ] 14.50% | 29,687 | 36.6% |
[ 14.5% - 15.0% ] 14.95% | 37,693 | 44.7% |
[ 15.0% - 15.5% ] 15.19% | 30,905 | 43.0% |
[ 15.0% - 15.5% ] 15.29% | 29,830 | 15.7% |
[ 15.5% - 16.0% ] 15.75% | 16,076 | 30.2% |
[ 16.0% - 16.5% ] 16.03% | 36,105 | 41.6% |
[ 16.0% - 16.5% ] 16.33% | 72,959 | 31.5% |
[ 16.5% - 17.0% ] 16.59% | 31,151 | 21.7% |
[ 16.5% - 17.0% ] 16.87% | 26,071 | 44.6% |
[ 17.0% - 17.5% ] 17.14% | 3,588 | 23.4% |
[ 17.0% - 17.5% ] 17.20% | 56,532 | 44.6% |
[ 17.5% - 18.0% ] 17.78% | 27,919 | 40.4% |
[ 18.5% - 19.0% ] 18.73% | 19,999 | 30.6% |
[ 19.0% - 19.5% ] 19.16% | 981 | 31.3% |
[ 19.0% - 19.5% ] 19.41% | 304 | 38.7% |
[ 19.5% - 20.0% ] 19.71% | 13,580 | 38.0% |
[ 20.0% - 20.5% ] 20.12% | 825 | 63.1% |
[ 20.0% - 20.5% ] 20.49% | 493 | 28.6% |
[ 21.0% - 21.5% ] 21.47% | 8,290 | 45.3% |
[ 23.0% - 23.5% ] 23.11% | 7,703 | 43.9% |
[ 23.0% - 23.5% ] 23.22% | 267 | 74.0% |
[ 23.5% - 24.0% ] 23.82% | 14,553 | 45.5% |
[ 24.0% - 24.5% ] 24.22% | 2,849 | 31.1% |
[ 24.5% - 25.0% ] 24.51% | 5,011 | 71.3% |
[ 24.5% - 25.0% ] 24.74% | 97 | 76.7% |
[ 25.5% - 26.0% ] 25.78% | 26,762 | 45.6% |
[ 26.0% - 26.5% ] 26.36% | 1,157 | 28.1% |
[ 29.0% - 29.5% ] 29.42% | 15,489 | 39.6% |
[ 30.0% - 30.5% ] 30.48% | 105 | 80.4% |
[ 32.5% - 33.0% ] 32.97% | 182 | 75.4% |
[ 33.0% - 33.5% ] 33.48% | 699 | 26.9% |
[ 35.5% - 36.0% ] 35.82% | 67 | 60.0% |
[ 36.0% - 36.5% ] 36.22% | 8,892 | 10.5% |
[ 39.0% - 39.5% ] 39.29% | 56 | 8.7% |
[ 54.5% - 55.0% ] 54.55% | 11 | 50.0% |