Immigrants from Africa GED/Equivalency
COMPARE
Immigrants from Africa
Select to Compare
GED/Equivalency
Immigrants from Africa GED/Equivalency
85.1%
GED/EQUIVALENCY
17.5/ 100
METRIC RATING
198th/ 347
METRIC RANK
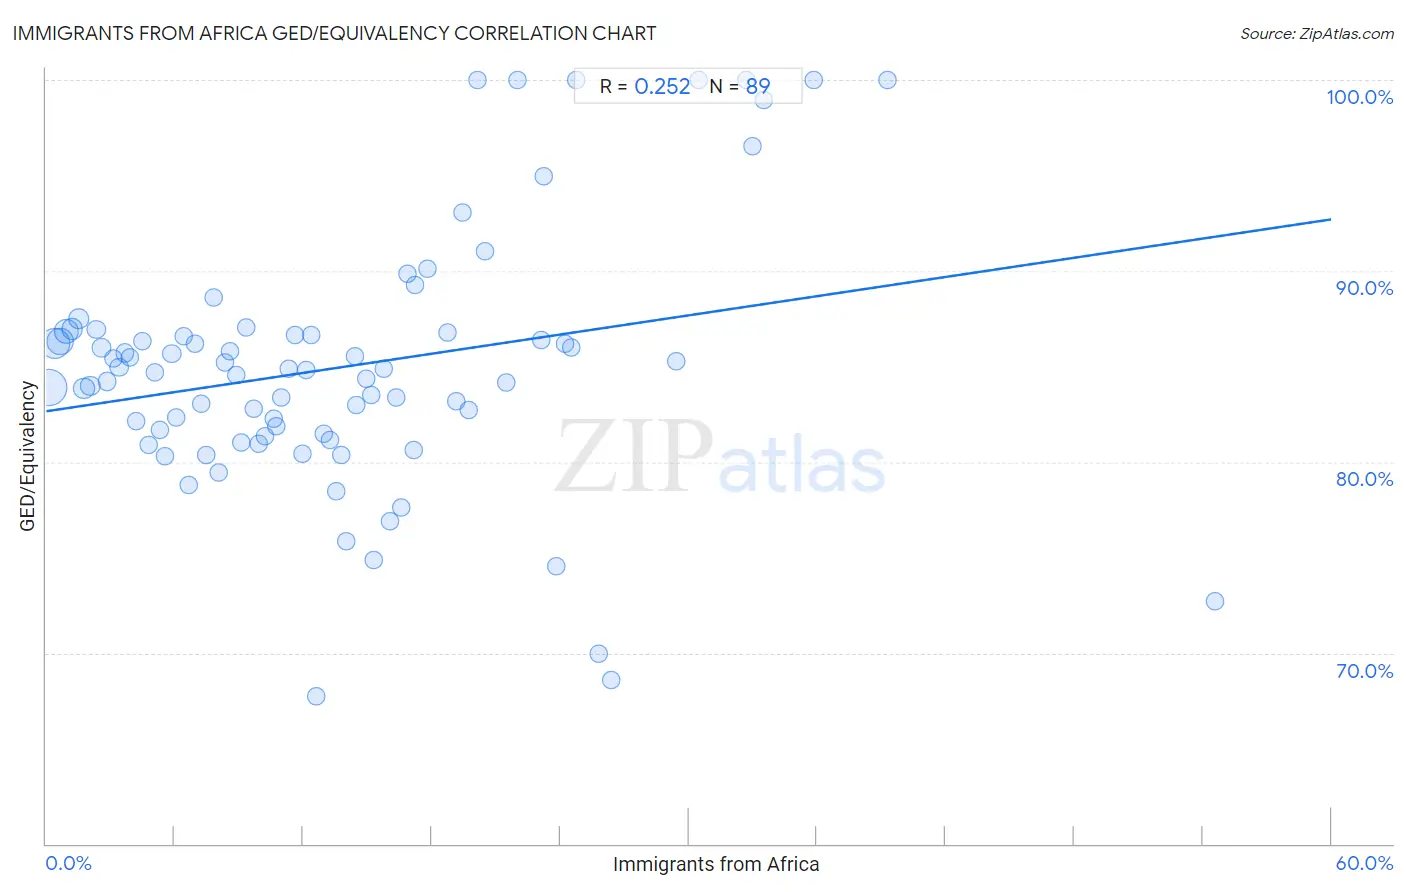
Immigrants from Africa GED/Equivalency Correlation Chart
The statistical analysis conducted on geographies consisting of 469,440,133 people shows a weak positive correlation between the proportion of Immigrants from Africa and percentage of population with at least ged/equivalency education in the United States with a correlation coefficient (R) of 0.252 and weighted average of 85.1%. On average, for every 1% (one percent) increase in Immigrants from Africa within a typical geography, there is an increase of 0.17% in percentage of population with at least ged/equivalency education.
It is essential to understand that the correlation between the percentage of Immigrants from Africa and percentage of population with at least ged/equivalency education does not imply a direct cause-and-effect relationship. It remains uncertain whether the presence of Immigrants from Africa influences an upward or downward trend in the level of percentage of population with at least ged/equivalency education within an area, or if Immigrants from Africa simply ended up residing in those areas with higher or lower levels of percentage of population with at least ged/equivalency education due to other factors.
Demographics Similar to Immigrants from Africa by GED/Equivalency
In terms of ged/equivalency, the demographic groups most similar to Immigrants from Africa are Somali (85.0%, a difference of 0.040%), Uruguayan (85.0%, a difference of 0.060%), Portuguese (85.0%, a difference of 0.060%), Cree (85.0%, a difference of 0.060%), and Panamanian (85.0%, a difference of 0.080%).
| Demographics | Rating | Rank | GED/Equivalency |
| South American Indians | 22.8 /100 | #191 | Fair 85.2% |
| Nonimmigrants | 22.7 /100 | #192 | Fair 85.2% |
| Delaware | 22.2 /100 | #193 | Fair 85.2% |
| Puget Sound Salish | 20.8 /100 | #194 | Fair 85.2% |
| Chippewa | 20.8 /100 | #195 | Fair 85.2% |
| Tongans | 20.7 /100 | #196 | Fair 85.2% |
| Costa Ricans | 20.4 /100 | #197 | Fair 85.2% |
| Immigrants from Africa | 17.5 /100 | #198 | Poor 85.1% |
| Somalis | 16.4 /100 | #199 | Poor 85.0% |
| Uruguayans | 16.0 /100 | #200 | Poor 85.0% |
| Portuguese | 15.9 /100 | #201 | Poor 85.0% |
| Cree | 15.9 /100 | #202 | Poor 85.0% |
| Panamanians | 15.3 /100 | #203 | Poor 85.0% |
| Hawaiians | 15.2 /100 | #204 | Poor 85.0% |
| Liberians | 14.6 /100 | #205 | Poor 85.0% |
Immigrants from Africa GED/Equivalency Correlation Summary
| Measurement | Immigrants from Africa Data | GED/Equivalency Data |
| Minimum | 0.13% | 67.7% |
| Maximum | 54.5% | 100.0% |
| Range | 54.4% | 32.3% |
| Mean | 13.7% | 85.0% |
| Median | 12.1% | 84.8% |
| Interquartile 25% (IQ1) | 6.0% | 81.4% |
| Interquartile 75% (IQ3) | 19.3% | 86.7% |
| Interquartile Range (IQR) | 13.3% | 5.3% |
| Standard Deviation (Sample) | 10.1% | 6.7% |
| Standard Deviation (Population) | 10.0% | 6.7% |
Correlation Details
| Immigrants from Africa Percentile | Sample Size | GED/Equivalency |
[ 0.0% - 0.5% ] 0.13% | 137,651,145 | 83.9% |
[ 0.0% - 0.5% ] 0.40% | 95,854,132 | 86.2% |
[ 0.5% - 1.0% ] 0.67% | 62,102,243 | 86.3% |
[ 0.5% - 1.0% ] 0.94% | 44,298,427 | 86.8% |
[ 1.0% - 1.5% ] 1.21% | 24,114,436 | 87.0% |
[ 1.0% - 1.5% ] 1.50% | 17,788,802 | 87.5% |
[ 1.5% - 2.0% ] 1.78% | 23,455,733 | 83.9% |
[ 2.0% - 2.5% ] 2.04% | 14,455,953 | 84.0% |
[ 2.0% - 2.5% ] 2.32% | 7,983,106 | 86.9% |
[ 2.5% - 3.0% ] 2.59% | 5,370,893 | 86.0% |
[ 2.5% - 3.0% ] 2.85% | 5,886,955 | 84.2% |
[ 3.0% - 3.5% ] 3.14% | 4,497,036 | 85.4% |
[ 3.0% - 3.5% ] 3.41% | 3,467,277 | 85.0% |
[ 3.5% - 4.0% ] 3.67% | 2,667,086 | 85.7% |
[ 3.5% - 4.0% ] 3.92% | 1,623,507 | 85.5% |
[ 4.0% - 4.5% ] 4.22% | 1,698,387 | 82.1% |
[ 4.0% - 4.5% ] 4.49% | 1,416,343 | 86.3% |
[ 4.5% - 5.0% ] 4.78% | 1,543,817 | 80.9% |
[ 5.0% - 5.5% ] 5.09% | 2,197,397 | 84.7% |
[ 5.0% - 5.5% ] 5.30% | 1,240,927 | 81.6% |
[ 5.5% - 6.0% ] 5.56% | 758,164 | 80.3% |
[ 5.5% - 6.0% ] 5.86% | 1,505,070 | 85.7% |
[ 6.0% - 6.5% ] 6.08% | 791,592 | 82.3% |
[ 6.0% - 6.5% ] 6.40% | 587,650 | 86.6% |
[ 6.5% - 7.0% ] 6.67% | 509,020 | 78.8% |
[ 6.5% - 7.0% ] 6.92% | 550,889 | 86.2% |
[ 7.0% - 7.5% ] 7.23% | 484,039 | 83.1% |
[ 7.0% - 7.5% ] 7.50% | 242,000 | 80.4% |
[ 7.5% - 8.0% ] 7.80% | 464,663 | 88.6% |
[ 8.0% - 8.5% ] 8.05% | 250,560 | 79.4% |
[ 8.0% - 8.5% ] 8.32% | 273,494 | 85.2% |
[ 8.5% - 9.0% ] 8.61% | 226,209 | 85.8% |
[ 8.5% - 9.0% ] 8.88% | 165,878 | 84.6% |
[ 9.0% - 9.5% ] 9.13% | 273,232 | 81.0% |
[ 9.0% - 9.5% ] 9.34% | 175,992 | 87.0% |
[ 9.5% - 10.0% ] 9.71% | 414,213 | 82.8% |
[ 9.5% - 10.0% ] 9.94% | 112,394 | 81.0% |
[ 10.0% - 10.5% ] 10.23% | 201,508 | 81.4% |
[ 10.5% - 11.0% ] 10.60% | 106,915 | 82.3% |
[ 10.5% - 11.0% ] 10.74% | 31,403 | 81.8% |
[ 10.5% - 11.0% ] 10.99% | 219,819 | 83.4% |
[ 11.0% - 11.5% ] 11.33% | 129,038 | 84.9% |
[ 11.5% - 12.0% ] 11.59% | 174,030 | 86.7% |
[ 11.5% - 12.0% ] 11.94% | 47,305 | 80.4% |
[ 12.0% - 12.5% ] 12.12% | 198,710 | 84.8% |
[ 12.0% - 12.5% ] 12.39% | 85,199 | 86.7% |
[ 12.5% - 13.0% ] 12.60% | 31,679 | 67.7% |
[ 12.5% - 13.0% ] 12.94% | 214,064 | 81.5% |
[ 13.0% - 13.5% ] 13.24% | 108,203 | 81.1% |
[ 13.5% - 14.0% ] 13.57% | 152,655 | 78.4% |
[ 13.5% - 14.0% ] 13.77% | 65,413 | 80.4% |
[ 14.0% - 14.5% ] 14.03% | 54,073 | 75.9% |
[ 14.0% - 14.5% ] 14.44% | 2,348 | 85.5% |
[ 14.5% - 15.0% ] 14.50% | 29,687 | 83.0% |
[ 14.5% - 15.0% ] 14.95% | 37,693 | 84.3% |
[ 15.0% - 15.5% ] 15.19% | 30,905 | 83.5% |
[ 15.0% - 15.5% ] 15.29% | 29,830 | 74.9% |
[ 15.5% - 16.0% ] 15.75% | 16,076 | 84.9% |
[ 16.0% - 16.5% ] 16.03% | 36,105 | 76.9% |
[ 16.0% - 16.5% ] 16.33% | 72,959 | 83.4% |
[ 16.5% - 17.0% ] 16.59% | 31,151 | 77.6% |
[ 16.5% - 17.0% ] 16.87% | 26,071 | 89.9% |
[ 17.0% - 17.5% ] 17.14% | 3,588 | 80.6% |
[ 17.0% - 17.5% ] 17.20% | 56,607 | 89.3% |
[ 17.5% - 18.0% ] 17.78% | 27,919 | 90.1% |
[ 18.5% - 19.0% ] 18.73% | 19,999 | 86.8% |
[ 19.0% - 19.5% ] 19.16% | 981 | 83.2% |
[ 19.0% - 19.5% ] 19.41% | 304 | 93.1% |
[ 19.5% - 20.0% ] 19.71% | 13,580 | 82.7% |
[ 20.0% - 20.5% ] 20.12% | 825 | 100.0% |
[ 20.0% - 20.5% ] 20.49% | 493 | 91.0% |
[ 21.0% - 21.5% ] 21.47% | 8,290 | 84.1% |
[ 22.0% - 22.5% ] 22.01% | 309 | 100.0% |
[ 23.0% - 23.5% ] 23.11% | 7,703 | 86.4% |
[ 23.0% - 23.5% ] 23.22% | 267 | 95.0% |
[ 23.5% - 24.0% ] 23.82% | 14,696 | 74.5% |
[ 24.0% - 24.5% ] 24.22% | 2,849 | 86.2% |
[ 24.5% - 25.0% ] 24.51% | 5,011 | 86.0% |
[ 24.5% - 25.0% ] 24.74% | 97 | 100.0% |
[ 25.5% - 26.0% ] 25.78% | 26,762 | 69.9% |
[ 26.0% - 26.5% ] 26.36% | 1,157 | 68.6% |
[ 29.0% - 29.5% ] 29.42% | 15,489 | 85.3% |
[ 30.0% - 30.5% ] 30.48% | 105 | 100.0% |
[ 32.5% - 33.0% ] 32.71% | 587 | 100.0% |
[ 32.5% - 33.0% ] 32.97% | 182 | 96.5% |
[ 33.0% - 33.5% ] 33.48% | 699 | 98.9% |
[ 35.5% - 36.0% ] 35.82% | 67 | 100.0% |
[ 39.0% - 39.5% ] 39.29% | 56 | 100.0% |
[ 54.5% - 55.0% ] 54.55% | 11 | 72.7% |