French Canadian 4 or more Vehicles in Household
COMPARE
French Canadian
Select to Compare
4 or more Vehicles in Household
French Canadian 4 or more Vehicles in Household
6.6%
4+ VEHICLES AVAILABLE
85.4/ 100
METRIC RATING
137th/ 347
METRIC RANK
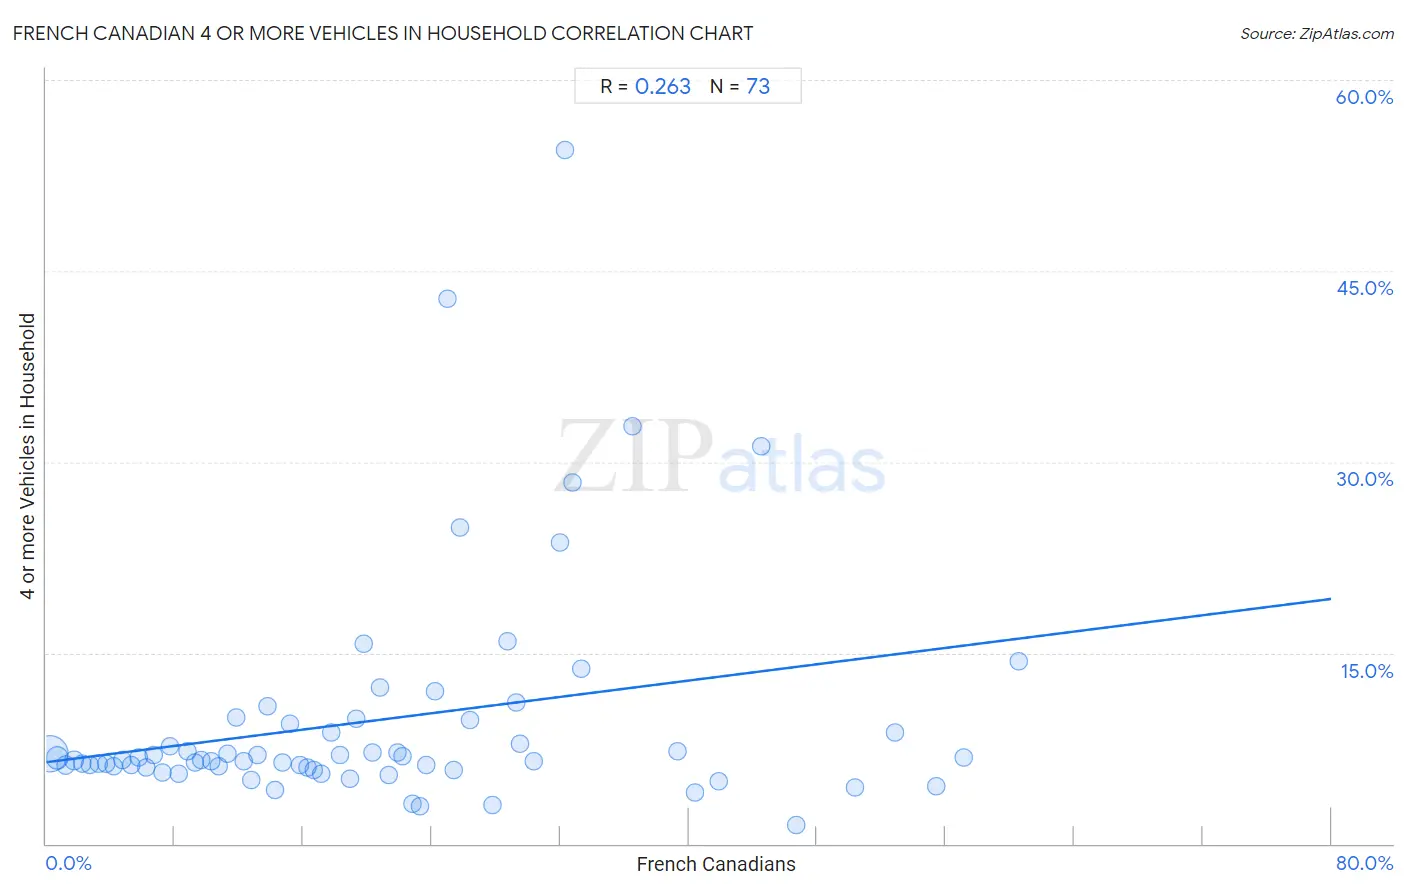
French Canadian 4 or more Vehicles in Household Correlation Chart
The statistical analysis conducted on geographies consisting of 500,260,140 people shows a weak positive correlation between the proportion of French Canadians and percentage of households with 4 or more vehicles available in the United States with a correlation coefficient (R) of 0.263 and weighted average of 6.6%. On average, for every 1% (one percent) increase in French Canadians within a typical geography, there is an increase of 0.16% in percentage of households with 4 or more vehicles available.
It is essential to understand that the correlation between the percentage of French Canadians and percentage of households with 4 or more vehicles available does not imply a direct cause-and-effect relationship. It remains uncertain whether the presence of French Canadians influences an upward or downward trend in the level of percentage of households with 4 or more vehicles available within an area, or if French Canadians simply ended up residing in those areas with higher or lower levels of percentage of households with 4 or more vehicles available due to other factors.
Demographics Similar to French Canadians by 4 or more Vehicles in Household
In terms of 4 or more vehicles in household, the demographic groups most similar to French Canadians are Italian (6.6%, a difference of 0.16%), Luxembourger (6.6%, a difference of 0.21%), Tohono O'odham (6.6%, a difference of 0.27%), Ottawa (6.6%, a difference of 0.30%), and Armenian (6.6%, a difference of 0.32%).
| Demographics | Rating | Rank | 4 or more Vehicles in Household |
| Immigrants from Scotland | 89.0 /100 | #130 | Excellent 6.7% |
| Maltese | 88.4 /100 | #131 | Excellent 6.7% |
| Immigrants from Netherlands | 87.8 /100 | #132 | Excellent 6.6% |
| Armenians | 86.9 /100 | #133 | Excellent 6.6% |
| Ottawa | 86.9 /100 | #134 | Excellent 6.6% |
| Tohono O'odham | 86.7 /100 | #135 | Excellent 6.6% |
| Luxembourgers | 86.4 /100 | #136 | Excellent 6.6% |
| French Canadians | 85.4 /100 | #137 | Excellent 6.6% |
| Italians | 84.5 /100 | #138 | Excellent 6.6% |
| Jordanians | 82.1 /100 | #139 | Excellent 6.6% |
| Slavs | 81.6 /100 | #140 | Excellent 6.6% |
| Australians | 80.8 /100 | #141 | Excellent 6.6% |
| Immigrants from Iraq | 79.4 /100 | #142 | Good 6.5% |
| Immigrants from Canada | 78.6 /100 | #143 | Good 6.5% |
| Immigrants from North America | 78.5 /100 | #144 | Good 6.5% |
French Canadian 4 or more Vehicles in Household Correlation Summary
| Measurement | French Canadian Data | 4 or more Vehicles in Household Data |
| Minimum | 0.21% | 1.5% |
| Maximum | 60.6% | 54.5% |
| Range | 60.4% | 53.0% |
| Mean | 20.6% | 9.7% |
| Median | 18.3% | 6.6% |
| Interquartile 25% (IQ1) | 9.0% | 6.0% |
| Interquartile 75% (IQ3) | 29.0% | 9.6% |
| Interquartile Range (IQR) | 20.0% | 3.6% |
| Standard Deviation (Sample) | 14.8% | 9.0% |
| Standard Deviation (Population) | 14.7% | 8.9% |
Correlation Details
| French Canadian Percentile | Sample Size | 4 or more Vehicles in Household |
[ 0.0% - 0.5% ] 0.21% | 362,062,243 | 7.1% |
[ 0.5% - 1.0% ] 0.68% | 81,493,867 | 6.7% |
[ 1.0% - 1.5% ] 1.21% | 22,332,778 | 6.2% |
[ 1.5% - 2.0% ] 1.73% | 9,650,112 | 6.5% |
[ 2.0% - 2.5% ] 2.24% | 5,739,607 | 6.3% |
[ 2.5% - 3.0% ] 2.71% | 3,463,088 | 6.2% |
[ 3.0% - 3.5% ] 3.26% | 2,692,245 | 6.3% |
[ 3.5% - 4.0% ] 3.75% | 2,036,199 | 6.3% |
[ 4.0% - 4.5% ] 4.22% | 1,506,836 | 6.1% |
[ 4.5% - 5.0% ] 4.75% | 1,213,529 | 6.6% |
[ 5.0% - 5.5% ] 5.27% | 1,012,586 | 6.1% |
[ 5.5% - 6.0% ] 5.72% | 793,166 | 6.8% |
[ 6.0% - 6.5% ] 6.24% | 909,107 | 6.0% |
[ 6.5% - 7.0% ] 6.72% | 677,529 | 6.9% |
[ 7.0% - 7.5% ] 7.21% | 720,674 | 5.6% |
[ 7.5% - 8.0% ] 7.72% | 525,800 | 7.7% |
[ 8.0% - 8.5% ] 8.24% | 741,477 | 5.5% |
[ 8.5% - 9.0% ] 8.76% | 230,039 | 7.2% |
[ 9.0% - 9.5% ] 9.26% | 349,950 | 6.4% |
[ 9.5% - 10.0% ] 9.66% | 219,955 | 6.6% |
[ 10.0% - 10.5% ] 10.27% | 371,937 | 6.5% |
[ 10.5% - 11.0% ] 10.77% | 280,508 | 6.1% |
[ 11.0% - 11.5% ] 11.26% | 129,778 | 7.1% |
[ 11.5% - 12.0% ] 11.79% | 69,897 | 9.9% |
[ 12.0% - 12.5% ] 12.27% | 121,276 | 6.4% |
[ 12.5% - 13.0% ] 12.74% | 252,536 | 5.0% |
[ 13.0% - 13.5% ] 13.16% | 39,388 | 7.0% |
[ 13.5% - 14.0% ] 13.74% | 39,140 | 10.8% |
[ 14.0% - 14.5% ] 14.24% | 100,728 | 4.2% |
[ 14.5% - 15.0% ] 14.72% | 69,785 | 6.3% |
[ 15.0% - 15.5% ] 15.15% | 23,135 | 9.4% |
[ 15.5% - 16.0% ] 15.76% | 58,933 | 6.1% |
[ 16.0% - 16.5% ] 16.27% | 36,482 | 6.0% |
[ 16.5% - 17.0% ] 16.64% | 29,514 | 5.8% |
[ 17.0% - 17.5% ] 17.11% | 50,451 | 5.5% |
[ 17.5% - 18.0% ] 17.71% | 10,950 | 8.7% |
[ 18.0% - 18.5% ] 18.25% | 21,901 | 7.0% |
[ 18.5% - 19.0% ] 18.94% | 94,565 | 5.2% |
[ 19.0% - 19.5% ] 19.29% | 24,414 | 9.8% |
[ 19.5% - 20.0% ] 19.77% | 1,487 | 15.7% |
[ 20.0% - 20.5% ] 20.35% | 17,053 | 7.2% |
[ 20.5% - 21.0% ] 20.80% | 7,203 | 12.2% |
[ 21.0% - 21.5% ] 21.35% | 5,779 | 5.4% |
[ 21.5% - 22.0% ] 21.86% | 2,342 | 7.2% |
[ 22.0% - 22.5% ] 22.19% | 1,361 | 6.8% |
[ 22.5% - 23.0% ] 22.83% | 1,323 | 3.1% |
[ 23.0% - 23.5% ] 23.28% | 1,817 | 3.0% |
[ 23.5% - 24.0% ] 23.64% | 461 | 6.2% |
[ 24.0% - 24.5% ] 24.18% | 2,457 | 12.0% |
[ 25.0% - 25.5% ] 25.00% | 48 | 42.9% |
[ 25.0% - 25.5% ] 25.37% | 6,425 | 5.7% |
[ 25.5% - 26.0% ] 25.73% | 443 | 24.8% |
[ 26.0% - 26.5% ] 26.35% | 3,727 | 9.7% |
[ 27.5% - 28.0% ] 27.82% | 1,668 | 3.1% |
[ 28.5% - 29.0% ] 28.74% | 609 | 15.9% |
[ 29.0% - 29.5% ] 29.24% | 554 | 11.0% |
[ 29.5% - 30.0% ] 29.51% | 427 | 7.8% |
[ 30.0% - 30.5% ] 30.32% | 155 | 6.5% |
[ 32.0% - 32.5% ] 32.00% | 100 | 23.6% |
[ 32.0% - 32.5% ] 32.29% | 384 | 54.5% |
[ 32.5% - 33.0% ] 32.77% | 946 | 28.4% |
[ 33.0% - 33.5% ] 33.33% | 57 | 13.8% |
[ 36.5% - 37.0% ] 36.52% | 994 | 32.8% |
[ 39.0% - 39.5% ] 39.30% | 1,524 | 7.2% |
[ 40.0% - 40.5% ] 40.38% | 416 | 4.0% |
[ 41.5% - 42.0% ] 41.90% | 358 | 4.9% |
[ 44.5% - 45.0% ] 44.55% | 110 | 31.2% |
[ 46.5% - 47.0% ] 46.70% | 576 | 1.5% |
[ 50.0% - 50.5% ] 50.36% | 137 | 4.4% |
[ 52.5% - 53.0% ] 52.83% | 53 | 8.7% |
[ 55.0% - 55.5% ] 55.41% | 915 | 4.5% |
[ 57.0% - 57.5% ] 57.15% | 1,398 | 6.8% |
[ 60.5% - 61.0% ] 60.58% | 728 | 14.4% |