French Canadian College, Under 1 year
COMPARE
French Canadian
Select to Compare
College, Under 1 year
French Canadian College, Under 1 year
64.2%
COLLEGE, UNDER 1 YEAR
16.3/ 100
METRIC RATING
201st/ 347
METRIC RANK
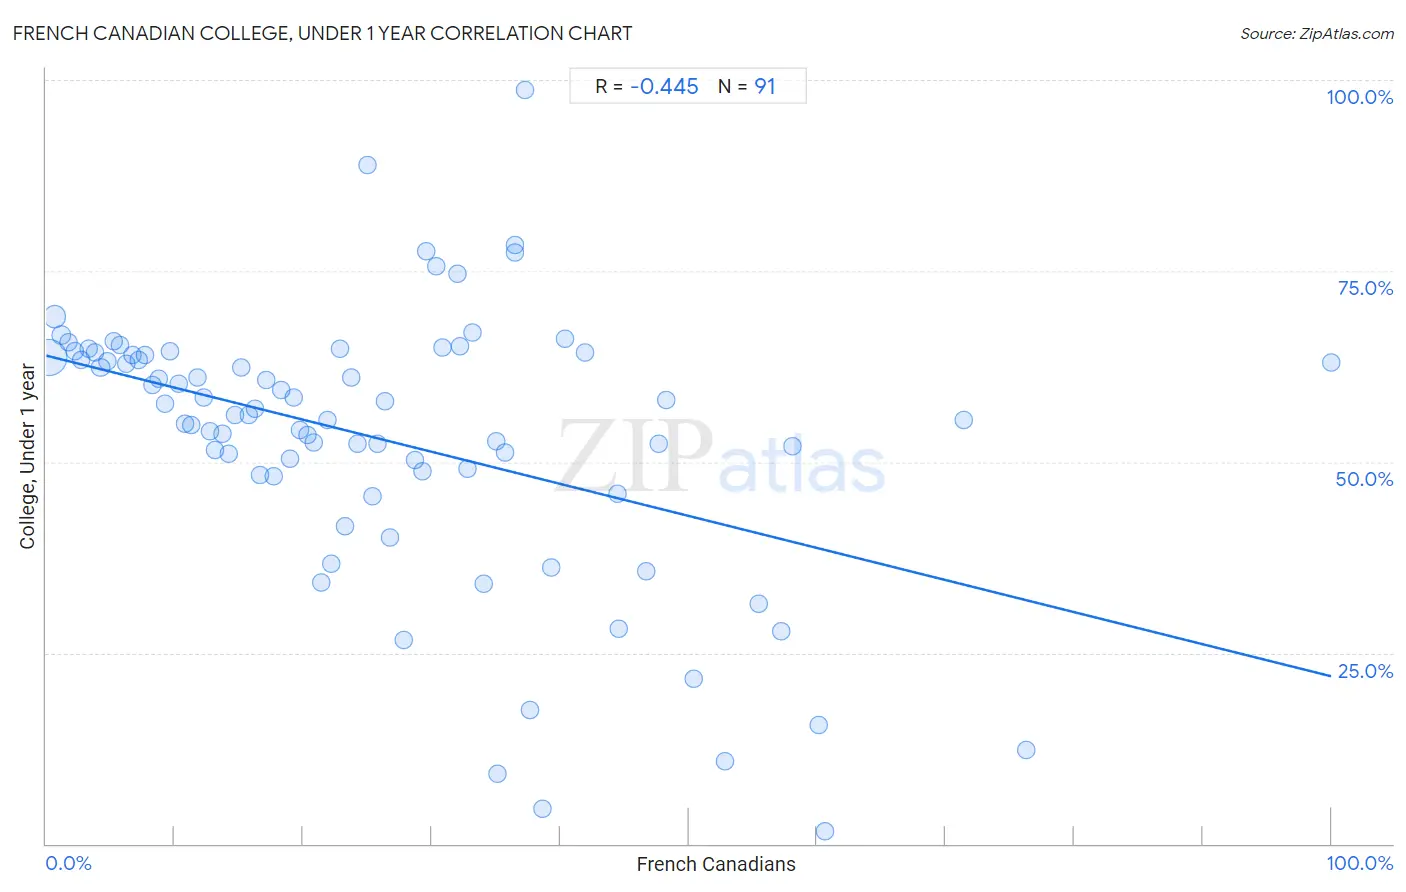
French Canadian College, Under 1 year Correlation Chart
The statistical analysis conducted on geographies consisting of 502,676,235 people shows a moderate negative correlation between the proportion of French Canadians and percentage of population with at least college, under 1 year education in the United States with a correlation coefficient (R) of -0.445 and weighted average of 64.2%. On average, for every 1% (one percent) increase in French Canadians within a typical geography, there is a decrease of 0.42% in percentage of population with at least college, under 1 year education.
It is essential to understand that the correlation between the percentage of French Canadians and percentage of population with at least college, under 1 year education does not imply a direct cause-and-effect relationship. It remains uncertain whether the presence of French Canadians influences an upward or downward trend in the level of percentage of population with at least college, under 1 year education within an area, or if French Canadians simply ended up residing in those areas with higher or lower levels of percentage of population with at least college, under 1 year education due to other factors.
Demographics Similar to French Canadians by College, Under 1 year
In terms of college, under 1 year, the demographic groups most similar to French Canadians are South American (64.2%, a difference of 0.010%), Nigerian (64.3%, a difference of 0.040%), Uruguayan (64.2%, a difference of 0.050%), Panamanian (64.3%, a difference of 0.060%), and Tsimshian (64.3%, a difference of 0.13%).
| Demographics | Rating | Rank | College, Under 1 year |
| Immigrants from Cameroon | 24.6 /100 | #194 | Fair 64.6% |
| Immigrants from South Eastern Asia | 22.1 /100 | #195 | Fair 64.5% |
| Tongans | 21.2 /100 | #196 | Fair 64.5% |
| Costa Ricans | 19.6 /100 | #197 | Poor 64.4% |
| Tsimshian | 17.9 /100 | #198 | Poor 64.3% |
| Panamanians | 17.0 /100 | #199 | Poor 64.3% |
| Nigerians | 16.7 /100 | #200 | Poor 64.3% |
| French Canadians | 16.3 /100 | #201 | Poor 64.2% |
| South Americans | 16.2 /100 | #202 | Poor 64.2% |
| Uruguayans | 15.6 /100 | #203 | Poor 64.2% |
| Immigrants from Zaire | 14.6 /100 | #204 | Poor 64.1% |
| Peruvians | 13.7 /100 | #205 | Poor 64.1% |
| Whites/Caucasians | 12.8 /100 | #206 | Poor 64.0% |
| Colombians | 12.4 /100 | #207 | Poor 64.0% |
| Immigrants from Vietnam | 12.1 /100 | #208 | Poor 64.0% |
French Canadian College, Under 1 year Correlation Summary
| Measurement | French Canadian Data | College, Under 1 year Data |
| Minimum | 0.21% | 1.7% |
| Maximum | 100.0% | 98.8% |
| Range | 99.8% | 97.1% |
| Mean | 25.9% | 53.0% |
| Median | 22.8% | 56.2% |
| Interquartile 25% (IQ1) | 11.3% | 48.3% |
| Interquartile 75% (IQ3) | 36.5% | 64.1% |
| Interquartile Range (IQR) | 25.2% | 15.8% |
| Standard Deviation (Sample) | 18.9% | 17.8% |
| Standard Deviation (Population) | 18.8% | 17.7% |
Correlation Details
| French Canadian Percentile | Sample Size | College, Under 1 year |
[ 0.0% - 0.5% ] 0.21% | 363,593,118 | 63.6% |
[ 0.5% - 1.0% ] 0.68% | 81,899,195 | 69.0% |
[ 1.0% - 1.5% ] 1.21% | 22,494,937 | 66.7% |
[ 1.5% - 2.0% ] 1.73% | 9,704,178 | 65.7% |
[ 2.0% - 2.5% ] 2.24% | 5,782,447 | 64.6% |
[ 2.5% - 3.0% ] 2.71% | 3,498,101 | 63.3% |
[ 3.0% - 3.5% ] 3.26% | 2,730,048 | 64.8% |
[ 3.5% - 4.0% ] 3.75% | 2,056,163 | 64.4% |
[ 4.0% - 4.5% ] 4.23% | 1,531,908 | 62.3% |
[ 4.5% - 5.0% ] 4.75% | 1,220,267 | 63.2% |
[ 5.0% - 5.5% ] 5.27% | 1,019,519 | 65.7% |
[ 5.5% - 6.0% ] 5.72% | 798,923 | 65.2% |
[ 6.0% - 6.5% ] 6.24% | 920,474 | 62.9% |
[ 6.5% - 7.0% ] 6.72% | 681,217 | 64.0% |
[ 7.0% - 7.5% ] 7.21% | 725,798 | 63.3% |
[ 7.5% - 8.0% ] 7.72% | 528,381 | 64.1% |
[ 8.0% - 8.5% ] 8.24% | 744,036 | 60.0% |
[ 8.5% - 9.0% ] 8.76% | 236,288 | 60.9% |
[ 9.0% - 9.5% ] 9.26% | 354,758 | 57.7% |
[ 9.5% - 10.0% ] 9.66% | 221,944 | 64.4% |
[ 10.0% - 10.5% ] 10.27% | 373,698 | 60.3% |
[ 10.5% - 11.0% ] 10.77% | 280,920 | 55.1% |
[ 11.0% - 11.5% ] 11.26% | 129,964 | 54.9% |
[ 11.5% - 12.0% ] 11.79% | 75,338 | 61.0% |
[ 12.0% - 12.5% ] 12.26% | 126,159 | 58.4% |
[ 12.5% - 13.0% ] 12.74% | 256,886 | 54.0% |
[ 13.0% - 13.5% ] 13.17% | 39,673 | 51.6% |
[ 13.5% - 14.0% ] 13.74% | 39,140 | 53.7% |
[ 14.0% - 14.5% ] 14.24% | 103,064 | 51.1% |
[ 14.5% - 15.0% ] 14.72% | 70,297 | 56.2% |
[ 15.0% - 15.5% ] 15.16% | 23,600 | 62.4% |
[ 15.5% - 16.0% ] 15.76% | 63,415 | 56.1% |
[ 16.0% - 16.5% ] 16.27% | 36,944 | 57.0% |
[ 16.5% - 17.0% ] 16.65% | 30,928 | 48.3% |
[ 17.0% - 17.5% ] 17.11% | 50,532 | 60.7% |
[ 17.5% - 18.0% ] 17.71% | 11,192 | 48.1% |
[ 18.0% - 18.5% ] 18.25% | 21,901 | 59.5% |
[ 18.5% - 19.0% ] 18.93% | 97,128 | 50.4% |
[ 19.0% - 19.5% ] 19.29% | 24,708 | 58.5% |
[ 19.5% - 20.0% ] 19.77% | 1,502 | 54.1% |
[ 20.0% - 20.5% ] 20.35% | 17,053 | 53.6% |
[ 20.5% - 21.0% ] 20.80% | 8,813 | 52.5% |
[ 21.0% - 21.5% ] 21.35% | 5,779 | 34.2% |
[ 21.5% - 22.0% ] 21.86% | 2,553 | 55.5% |
[ 22.0% - 22.5% ] 22.19% | 1,361 | 36.6% |
[ 22.5% - 23.0% ] 22.82% | 1,626 | 64.9% |
[ 23.0% - 23.5% ] 23.27% | 1,981 | 41.6% |
[ 23.5% - 24.0% ] 23.70% | 637 | 61.1% |
[ 24.0% - 24.5% ] 24.18% | 2,457 | 52.4% |
[ 25.0% - 25.5% ] 25.00% | 96 | 88.9% |
[ 25.0% - 25.5% ] 25.37% | 6,776 | 45.5% |
[ 25.5% - 26.0% ] 25.75% | 532 | 52.4% |
[ 26.0% - 26.5% ] 26.35% | 3,727 | 58.0% |
[ 26.5% - 27.0% ] 26.77% | 127 | 40.1% |
[ 27.5% - 28.0% ] 27.82% | 1,693 | 26.7% |
[ 28.5% - 29.0% ] 28.73% | 644 | 50.3% |
[ 29.0% - 29.5% ] 29.24% | 554 | 48.8% |
[ 29.5% - 30.0% ] 29.57% | 947 | 77.6% |
[ 30.0% - 30.5% ] 30.38% | 339 | 75.7% |
[ 30.5% - 31.0% ] 30.88% | 408 | 65.0% |
[ 31.5% - 32.0% ] 31.96% | 219 | 74.6% |
[ 32.0% - 32.5% ] 32.23% | 667 | 65.2% |
[ 32.5% - 33.0% ] 32.78% | 1,022 | 49.1% |
[ 33.0% - 33.5% ] 33.15% | 540 | 67.0% |
[ 34.0% - 34.5% ] 34.02% | 388 | 34.1% |
[ 34.5% - 35.0% ] 34.98% | 3,190 | 52.7% |
[ 35.0% - 35.5% ] 35.11% | 131 | 9.1% |
[ 35.5% - 36.0% ] 35.66% | 2,883 | 51.3% |
[ 36.0% - 36.5% ] 36.47% | 340 | 78.4% |
[ 36.5% - 37.0% ] 36.52% | 994 | 77.4% |
[ 37.0% - 37.5% ] 37.21% | 129 | 98.8% |
[ 37.5% - 38.0% ] 37.63% | 1,116 | 17.5% |
[ 38.5% - 39.0% ] 38.61% | 101 | 4.6% |
[ 39.0% - 39.5% ] 39.30% | 1,603 | 36.1% |
[ 40.0% - 40.5% ] 40.38% | 416 | 66.1% |
[ 41.5% - 42.0% ] 41.88% | 394 | 64.3% |
[ 44.0% - 44.5% ] 44.44% | 72 | 45.8% |
[ 44.5% - 45.0% ] 44.55% | 110 | 28.2% |
[ 46.5% - 47.0% ] 46.70% | 576 | 35.7% |
[ 47.5% - 48.0% ] 47.62% | 21 | 52.4% |
[ 48.0% - 48.5% ] 48.25% | 286 | 58.1% |
[ 50.0% - 50.5% ] 50.36% | 137 | 21.7% |
[ 52.5% - 53.0% ] 52.83% | 53 | 10.9% |
[ 55.0% - 55.5% ] 55.41% | 915 | 31.5% |
[ 57.0% - 57.5% ] 57.15% | 1,398 | 27.9% |
[ 58.0% - 58.5% ] 58.09% | 346 | 52.1% |
[ 60.0% - 60.5% ] 60.07% | 283 | 15.5% |
[ 60.5% - 61.0% ] 60.58% | 728 | 1.7% |
[ 71.0% - 71.5% ] 71.43% | 14 | 55.6% |
[ 76.0% - 76.5% ] 76.31% | 325 | 12.3% |
[ 99.5% - 100.0% ] 100.00% | 46 | 63.0% |