French Canadian Married-Couple Family Poverty
COMPARE
French Canadian
Select to Compare
Married-Couple Family Poverty
French Canadian Married-Couple Family Poverty
4.2%
POVERTY | MARRIED-COUPLE FAMILIES
99.8/ 100
METRIC RATING
40th/ 347
METRIC RANK
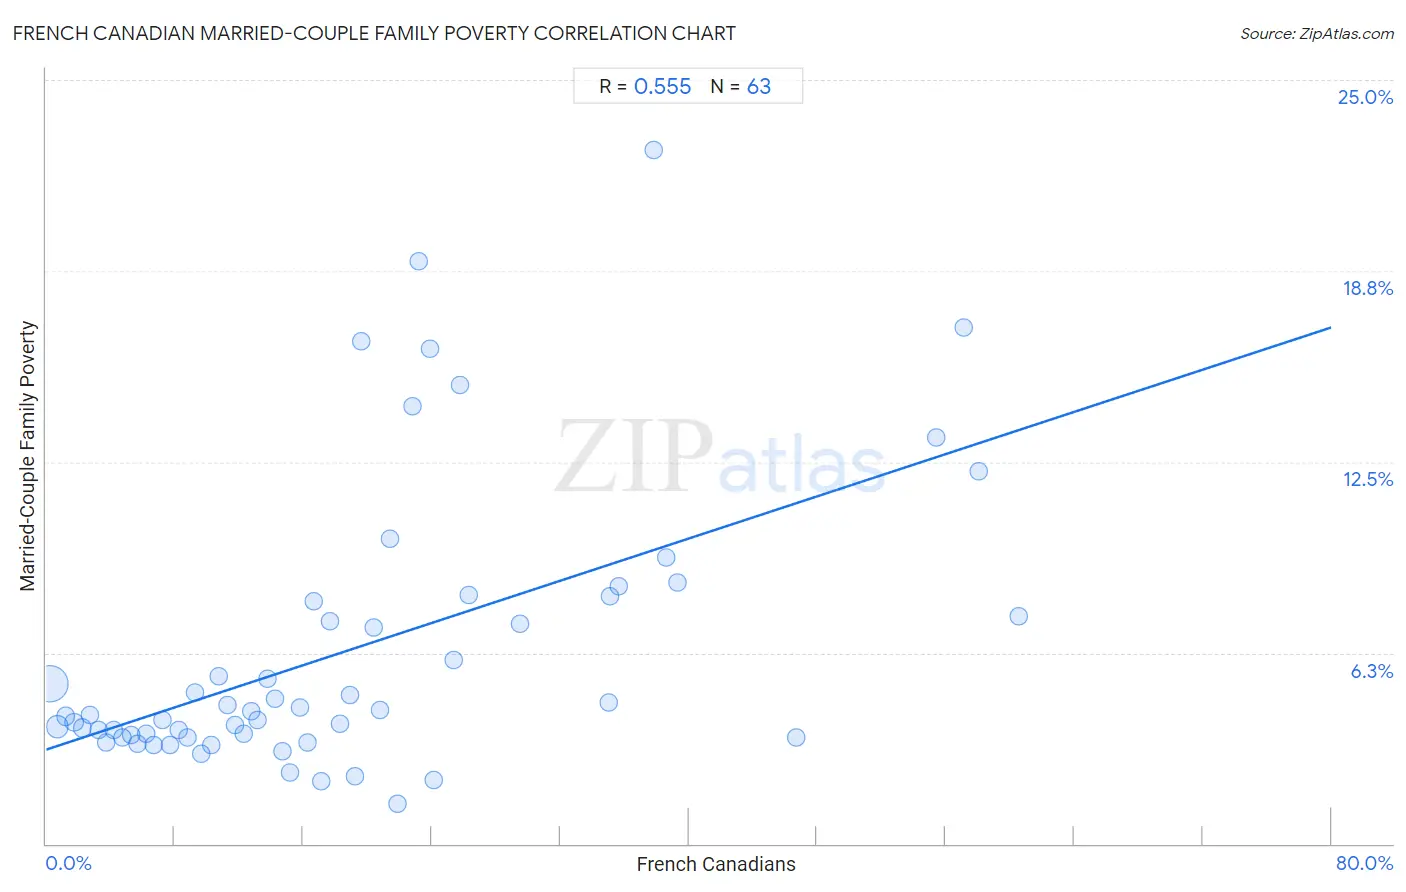
French Canadian Married-Couple Family Poverty Correlation Chart
The statistical analysis conducted on geographies consisting of 493,719,375 people shows a substantial positive correlation between the proportion of French Canadians and poverty level among married-couple families in the United States with a correlation coefficient (R) of 0.555 and weighted average of 4.2%. On average, for every 1% (one percent) increase in French Canadians within a typical geography, there is an increase of 0.17% in poverty level among married-couple families.
It is essential to understand that the correlation between the percentage of French Canadians and poverty level among married-couple families does not imply a direct cause-and-effect relationship. It remains uncertain whether the presence of French Canadians influences an upward or downward trend in the level of poverty level among married-couple families within an area, or if French Canadians simply ended up residing in those areas with higher or lower levels of poverty level among married-couple families due to other factors.
Demographics Similar to French Canadians by Married-Couple Family Poverty
In terms of married-couple family poverty, the demographic groups most similar to French Canadians are Northern European (4.3%, a difference of 0.25%), Immigrants from Northern Europe (4.2%, a difference of 0.28%), Belgian (4.2%, a difference of 0.41%), Scottish (4.3%, a difference of 0.41%), and Iranian (4.2%, a difference of 0.53%).
| Demographics | Rating | Rank | Married-Couple Family Poverty |
| Irish | 99.9 /100 | #33 | Exceptional 4.2% |
| Dutch | 99.9 /100 | #34 | Exceptional 4.2% |
| Europeans | 99.9 /100 | #35 | Exceptional 4.2% |
| English | 99.9 /100 | #36 | Exceptional 4.2% |
| Iranians | 99.9 /100 | #37 | Exceptional 4.2% |
| Belgians | 99.9 /100 | #38 | Exceptional 4.2% |
| Immigrants from Northern Europe | 99.8 /100 | #39 | Exceptional 4.2% |
| French Canadians | 99.8 /100 | #40 | Exceptional 4.2% |
| Northern Europeans | 99.8 /100 | #41 | Exceptional 4.3% |
| Scottish | 99.8 /100 | #42 | Exceptional 4.3% |
| Swiss | 99.8 /100 | #43 | Exceptional 4.3% |
| Immigrants from Japan | 99.8 /100 | #44 | Exceptional 4.3% |
| Serbians | 99.8 /100 | #45 | Exceptional 4.3% |
| British | 99.8 /100 | #46 | Exceptional 4.3% |
| Immigrants from South Central Asia | 99.8 /100 | #47 | Exceptional 4.3% |
French Canadian Married-Couple Family Poverty Correlation Summary
| Measurement | French Canadian Data | Married-Couple Family Poverty Data |
| Minimum | 0.21% | 1.3% |
| Maximum | 60.6% | 22.7% |
| Range | 60.4% | 21.4% |
| Mean | 18.8% | 6.3% |
| Median | 15.8% | 4.3% |
| Interquartile 25% (IQ1) | 7.7% | 3.5% |
| Interquartile 75% (IQ3) | 24.1% | 8.0% |
| Interquartile Range (IQR) | 16.4% | 4.5% |
| Standard Deviation (Sample) | 14.9% | 4.6% |
| Standard Deviation (Population) | 14.7% | 4.6% |
Correlation Details
| French Canadian Percentile | Sample Size | Married-Couple Family Poverty |
[ 0.0% - 0.5% ] 0.21% | 359,899,236 | 5.2% |
[ 0.5% - 1.0% ] 0.68% | 79,943,102 | 3.8% |
[ 1.0% - 1.5% ] 1.21% | 21,713,821 | 4.2% |
[ 1.5% - 2.0% ] 1.73% | 9,227,763 | 4.0% |
[ 2.0% - 2.5% ] 2.24% | 5,453,402 | 3.8% |
[ 2.5% - 3.0% ] 2.71% | 3,213,581 | 4.2% |
[ 3.0% - 3.5% ] 3.26% | 2,592,856 | 3.7% |
[ 3.5% - 4.0% ] 3.76% | 1,861,777 | 3.3% |
[ 4.0% - 4.5% ] 4.22% | 1,366,776 | 3.7% |
[ 4.5% - 5.0% ] 4.75% | 1,128,177 | 3.5% |
[ 5.0% - 5.5% ] 5.27% | 902,109 | 3.6% |
[ 5.5% - 6.0% ] 5.72% | 726,953 | 3.3% |
[ 6.0% - 6.5% ] 6.24% | 834,518 | 3.6% |
[ 6.5% - 7.0% ] 6.72% | 576,060 | 3.2% |
[ 7.0% - 7.5% ] 7.21% | 680,178 | 4.1% |
[ 7.5% - 8.0% ] 7.72% | 469,014 | 3.2% |
[ 8.0% - 8.5% ] 8.24% | 711,202 | 3.7% |
[ 8.5% - 9.0% ] 8.76% | 214,942 | 3.5% |
[ 9.0% - 9.5% ] 9.25% | 282,642 | 4.9% |
[ 9.5% - 10.0% ] 9.66% | 203,322 | 2.9% |
[ 10.0% - 10.5% ] 10.28% | 326,964 | 3.2% |
[ 10.5% - 11.0% ] 10.77% | 264,545 | 5.5% |
[ 11.0% - 11.5% ] 11.27% | 111,414 | 4.6% |
[ 11.5% - 12.0% ] 11.78% | 51,040 | 3.9% |
[ 12.0% - 12.5% ] 12.27% | 112,110 | 3.6% |
[ 12.5% - 13.0% ] 12.74% | 240,747 | 4.3% |
[ 13.0% - 13.5% ] 13.16% | 38,896 | 4.1% |
[ 13.5% - 14.0% ] 13.77% | 28,419 | 5.4% |
[ 14.0% - 14.5% ] 14.24% | 91,640 | 4.8% |
[ 14.5% - 15.0% ] 14.71% | 67,713 | 3.0% |
[ 15.0% - 15.5% ] 15.15% | 22,218 | 2.3% |
[ 15.5% - 16.0% ] 15.79% | 54,411 | 4.4% |
[ 16.0% - 16.5% ] 16.27% | 36,094 | 3.3% |
[ 16.5% - 17.0% ] 16.63% | 27,691 | 8.0% |
[ 17.0% - 17.5% ] 17.11% | 49,907 | 2.1% |
[ 17.5% - 18.0% ] 17.70% | 9,073 | 7.3% |
[ 18.0% - 18.5% ] 18.27% | 17,866 | 3.9% |
[ 18.5% - 19.0% ] 18.93% | 94,416 | 4.9% |
[ 19.0% - 19.5% ] 19.25% | 19,244 | 2.2% |
[ 19.5% - 20.0% ] 19.64% | 499 | 16.5% |
[ 20.0% - 20.5% ] 20.36% | 13,012 | 7.1% |
[ 20.5% - 21.0% ] 20.79% | 7,324 | 4.4% |
[ 21.0% - 21.5% ] 21.37% | 4,833 | 10.0% |
[ 21.5% - 22.0% ] 21.86% | 2,342 | 1.3% |
[ 22.5% - 23.0% ] 22.81% | 1,201 | 14.3% |
[ 23.0% - 23.5% ] 23.17% | 164 | 19.0% |
[ 23.5% - 24.0% ] 23.91% | 138 | 16.2% |
[ 24.0% - 24.5% ] 24.13% | 1,915 | 2.1% |
[ 25.0% - 25.5% ] 25.37% | 6,425 | 6.0% |
[ 25.5% - 26.0% ] 25.73% | 241 | 15.0% |
[ 26.0% - 26.5% ] 26.32% | 3,104 | 8.1% |
[ 29.5% - 30.0% ] 29.51% | 427 | 7.2% |
[ 34.5% - 35.0% ] 34.98% | 3,190 | 4.6% |
[ 35.0% - 35.5% ] 35.11% | 131 | 8.1% |
[ 35.5% - 36.0% ] 35.66% | 2,883 | 8.4% |
[ 37.5% - 38.0% ] 37.82% | 119 | 22.7% |
[ 38.5% - 39.0% ] 38.61% | 101 | 9.4% |
[ 39.0% - 39.5% ] 39.30% | 1,524 | 8.6% |
[ 46.5% - 47.0% ] 46.70% | 576 | 3.5% |
[ 55.0% - 55.5% ] 55.41% | 915 | 13.3% |
[ 57.0% - 57.5% ] 57.15% | 1,398 | 16.9% |
[ 58.0% - 58.5% ] 58.09% | 346 | 12.2% |
[ 60.5% - 61.0% ] 60.58% | 728 | 7.4% |