French Canadian Self-Care Disability
COMPARE
French Canadian
Select to Compare
Self-Care Disability
French Canadian Self-Care Disability
2.6%
SELF-CARE DISABILITY
3.8/ 100
METRIC RATING
223rd/ 347
METRIC RANK
French Canadian Self-Care Disability Correlation Chart
The statistical analysis conducted on geographies consisting of 501,457,429 people shows a moderate positive correlation between the proportion of French Canadians and percentage of population with self-care disability in the United States with a correlation coefficient (R) of 0.459 and weighted average of 2.6%. On average, for every 1% (one percent) increase in French Canadians within a typical geography, there is an increase of 0.055% in percentage of population with self-care disability.
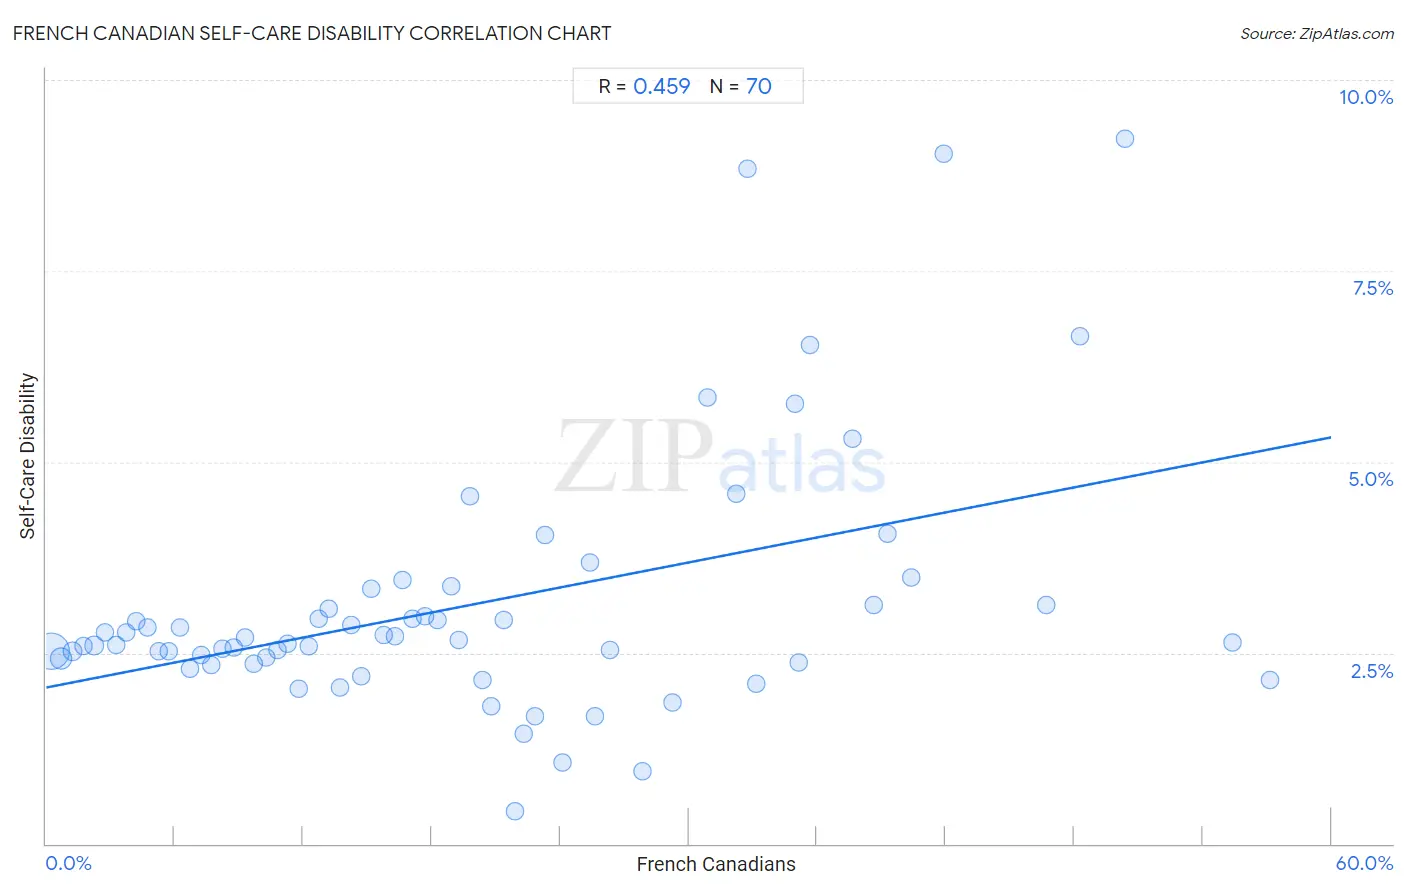
It is essential to understand that the correlation between the percentage of French Canadians and percentage of population with self-care disability does not imply a direct cause-and-effect relationship. It remains uncertain whether the presence of French Canadians influences an upward or downward trend in the level of percentage of population with self-care disability within an area, or if French Canadians simply ended up residing in those areas with higher or lower levels of percentage of population with self-care disability due to other factors.
Demographics Similar to French Canadians by Self-Care Disability
In terms of self-care disability, the demographic groups most similar to French Canadians are Spaniard (2.6%, a difference of 0.0%), Honduran (2.6%, a difference of 0.020%), Subsaharan African (2.6%, a difference of 0.050%), Osage (2.6%, a difference of 0.050%), and Immigrants from Moldova (2.6%, a difference of 0.060%).
| Demographics | Rating | Rank | Self-Care Disability |
| Whites/Caucasians | 4.4 /100 | #216 | Tragic 2.6% |
| Celtics | 4.4 /100 | #217 | Tragic 2.6% |
| Scotch-Irish | 4.1 /100 | #218 | Tragic 2.6% |
| Immigrants from Moldova | 4.0 /100 | #219 | Tragic 2.6% |
| Sub-Saharan Africans | 4.0 /100 | #220 | Tragic 2.6% |
| Hondurans | 3.8 /100 | #221 | Tragic 2.6% |
| Spaniards | 3.8 /100 | #222 | Tragic 2.6% |
| French Canadians | 3.8 /100 | #223 | Tragic 2.6% |
| Osage | 3.6 /100 | #224 | Tragic 2.6% |
| Iraqis | 3.2 /100 | #225 | Tragic 2.6% |
| Chinese | 2.9 /100 | #226 | Tragic 2.6% |
| Immigrants from Philippines | 2.7 /100 | #227 | Tragic 2.6% |
| Guatemalans | 2.7 /100 | #228 | Tragic 2.6% |
| Guamanians/Chamorros | 2.5 /100 | #229 | Tragic 2.6% |
| Immigrants from Ecuador | 2.5 /100 | #230 | Tragic 2.6% |
French Canadian Self-Care Disability Correlation Summary
| Measurement | French Canadian Data | Self-Care Disability Data |
| Minimum | 0.21% | 0.42% |
| Maximum | 57.2% | 9.2% |
| Range | 56.9% | 8.8% |
| Mean | 20.0% | 3.1% |
| Median | 17.4% | 2.7% |
| Interquartile 25% (IQ1) | 8.8% | 2.4% |
| Interquartile 75% (IQ3) | 29.2% | 3.1% |
| Interquartile Range (IQR) | 20.5% | 0.74% |
| Standard Deviation (Sample) | 14.2% | 1.7% |
| Standard Deviation (Population) | 14.1% | 1.7% |
Correlation Details
| French Canadian Percentile | Sample Size | Self-Care Disability |
[ 0.0% - 0.5% ] 0.21% | 363,129,114 | 2.5% |
[ 0.5% - 1.0% ] 0.68% | 81,608,224 | 2.4% |
[ 1.0% - 1.5% ] 1.21% | 22,369,829 | 2.5% |
[ 1.5% - 2.0% ] 1.73% | 9,638,565 | 2.6% |
[ 2.0% - 2.5% ] 2.24% | 5,740,323 | 2.6% |
[ 2.5% - 3.0% ] 2.71% | 3,467,909 | 2.8% |
[ 3.0% - 3.5% ] 3.26% | 2,705,008 | 2.6% |
[ 3.5% - 4.0% ] 3.75% | 2,035,934 | 2.8% |
[ 4.0% - 4.5% ] 4.22% | 1,509,122 | 2.9% |
[ 4.5% - 5.0% ] 4.75% | 1,209,861 | 2.8% |
[ 5.0% - 5.5% ] 5.27% | 1,006,863 | 2.5% |
[ 5.5% - 6.0% ] 5.72% | 782,836 | 2.5% |
[ 6.0% - 6.5% ] 6.24% | 914,128 | 2.8% |
[ 6.5% - 7.0% ] 6.72% | 668,184 | 2.3% |
[ 7.0% - 7.5% ] 7.21% | 721,702 | 2.5% |
[ 7.5% - 8.0% ] 7.72% | 522,902 | 2.3% |
[ 8.0% - 8.5% ] 8.24% | 736,976 | 2.6% |
[ 8.5% - 9.0% ] 8.76% | 230,269 | 2.6% |
[ 9.0% - 9.5% ] 9.26% | 352,174 | 2.7% |
[ 9.5% - 10.0% ] 9.66% | 218,471 | 2.4% |
[ 10.0% - 10.5% ] 10.27% | 372,369 | 2.4% |
[ 10.5% - 11.0% ] 10.77% | 278,902 | 2.5% |
[ 11.0% - 11.5% ] 11.26% | 128,779 | 2.6% |
[ 11.5% - 12.0% ] 11.79% | 72,625 | 2.0% |
[ 12.0% - 12.5% ] 12.26% | 123,193 | 2.6% |
[ 12.5% - 13.0% ] 12.74% | 254,002 | 2.9% |
[ 13.0% - 13.5% ] 13.16% | 39,231 | 3.1% |
[ 13.5% - 14.0% ] 13.73% | 37,128 | 2.0% |
[ 14.0% - 14.5% ] 14.24% | 101,644 | 2.9% |
[ 14.5% - 15.0% ] 14.71% | 69,463 | 2.2% |
[ 15.0% - 15.5% ] 15.16% | 22,922 | 3.3% |
[ 15.5% - 16.0% ] 15.78% | 57,962 | 2.7% |
[ 16.0% - 16.5% ] 16.27% | 36,482 | 2.7% |
[ 16.5% - 17.0% ] 16.64% | 28,458 | 3.5% |
[ 17.0% - 17.5% ] 17.11% | 50,353 | 2.9% |
[ 17.5% - 18.0% ] 17.71% | 10,496 | 3.0% |
[ 18.0% - 18.5% ] 18.25% | 21,901 | 2.9% |
[ 18.5% - 19.0% ] 18.94% | 94,407 | 3.4% |
[ 19.0% - 19.5% ] 19.28% | 22,426 | 2.7% |
[ 19.5% - 20.0% ] 19.77% | 1,285 | 4.5% |
[ 20.0% - 20.5% ] 20.35% | 16,663 | 2.1% |
[ 20.5% - 21.0% ] 20.79% | 7,392 | 1.8% |
[ 21.0% - 21.5% ] 21.35% | 5,779 | 2.9% |
[ 21.5% - 22.0% ] 21.86% | 2,310 | 0.42% |
[ 22.0% - 22.5% ] 22.29% | 691 | 1.4% |
[ 22.5% - 23.0% ] 22.83% | 1,323 | 1.7% |
[ 23.0% - 23.5% ] 23.28% | 1,903 | 4.0% |
[ 24.0% - 24.5% ] 24.13% | 1,915 | 1.1% |
[ 25.0% - 25.5% ] 25.37% | 6,425 | 3.7% |
[ 25.5% - 26.0% ] 25.62% | 121 | 1.7% |
[ 26.0% - 26.5% ] 26.32% | 3,104 | 2.5% |
[ 27.5% - 28.0% ] 27.82% | 1,668 | 0.95% |
[ 29.0% - 29.5% ] 29.24% | 513 | 1.9% |
[ 30.5% - 31.0% ] 30.89% | 327 | 5.8% |
[ 32.0% - 32.5% ] 32.21% | 298 | 4.6% |
[ 32.5% - 33.0% ] 32.77% | 946 | 8.8% |
[ 33.0% - 33.5% ] 33.13% | 483 | 2.1% |
[ 34.5% - 35.0% ] 34.98% | 3,190 | 5.8% |
[ 35.0% - 35.5% ] 35.11% | 131 | 2.4% |
[ 35.5% - 36.0% ] 35.66% | 2,883 | 6.5% |
[ 37.5% - 38.0% ] 37.63% | 1,116 | 5.3% |
[ 38.5% - 39.0% ] 38.61% | 101 | 3.1% |
[ 39.0% - 39.5% ] 39.30% | 1,603 | 4.1% |
[ 40.0% - 40.5% ] 40.38% | 416 | 3.5% |
[ 41.5% - 42.0% ] 41.88% | 394 | 9.0% |
[ 46.5% - 47.0% ] 46.70% | 576 | 3.1% |
[ 48.0% - 48.5% ] 48.25% | 286 | 6.6% |
[ 50.0% - 50.5% ] 50.36% | 137 | 9.2% |
[ 55.0% - 55.5% ] 55.41% | 915 | 2.6% |
[ 57.0% - 57.5% ] 57.15% | 1,398 | 2.1% |