French Canadian Disability
COMPARE
French Canadian
Select to Compare
Disability
French Canadian Disability
13.4%
DISABILITY
0.0/ 100
METRIC RATING
305th/ 347
METRIC RANK
French Canadian Disability Correlation Chart
The statistical analysis conducted on geographies consisting of 502,588,623 people shows a poor positive correlation between the proportion of French Canadians and percentage of population with a disability in the United States with a correlation coefficient (R) of 0.173 and weighted average of 13.4%. On average, for every 1% (one percent) increase in French Canadians within a typical geography, there is an increase of 0.064% in percentage of population with a disability.
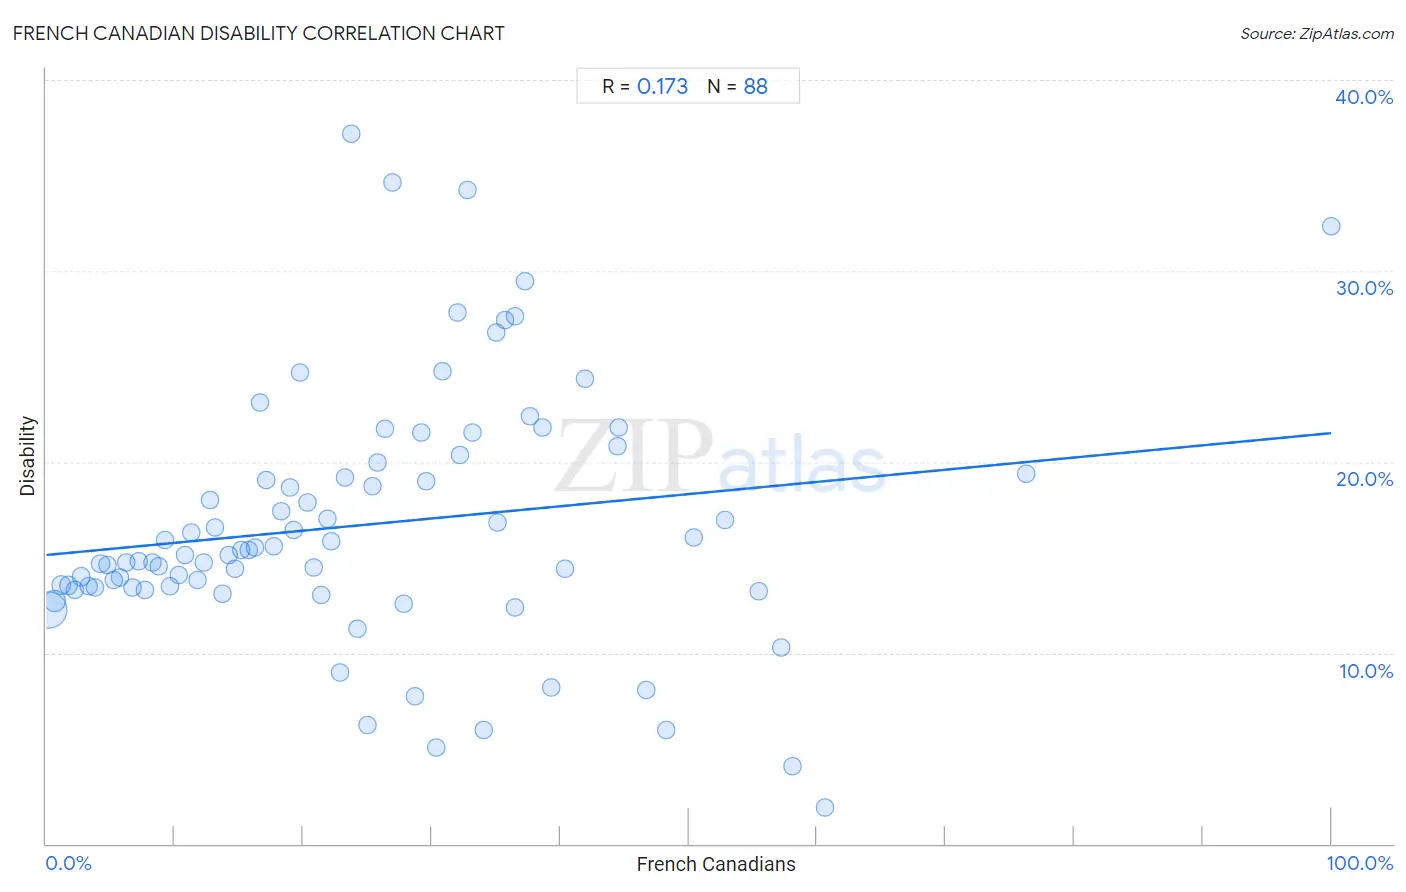
It is essential to understand that the correlation between the percentage of French Canadians and percentage of population with a disability does not imply a direct cause-and-effect relationship. It remains uncertain whether the presence of French Canadians influences an upward or downward trend in the level of percentage of population with a disability within an area, or if French Canadians simply ended up residing in those areas with higher or lower levels of percentage of population with a disability due to other factors.
Demographics Similar to French Canadians by Disability
In terms of disability, the demographic groups most similar to French Canadians are Yakama (13.4%, a difference of 0.35%), Cape Verdean (13.5%, a difference of 0.61%), Shoshone (13.5%, a difference of 0.66%), French American Indian (13.5%, a difference of 0.75%), and Scotch-Irish (13.3%, a difference of 0.81%).
| Demographics | Rating | Rank | Disability |
| Alaska Natives | 0.0 /100 | #298 | Tragic 13.2% |
| French | 0.0 /100 | #299 | Tragic 13.2% |
| Pennsylvania Germans | 0.0 /100 | #300 | Tragic 13.2% |
| Immigrants from Micronesia | 0.0 /100 | #301 | Tragic 13.2% |
| Arapaho | 0.0 /100 | #302 | Tragic 13.2% |
| Scotch-Irish | 0.0 /100 | #303 | Tragic 13.3% |
| Yakama | 0.0 /100 | #304 | Tragic 13.4% |
| French Canadians | 0.0 /100 | #305 | Tragic 13.4% |
| Cape Verdeans | 0.0 /100 | #306 | Tragic 13.5% |
| Shoshone | 0.0 /100 | #307 | Tragic 13.5% |
| French American Indians | 0.0 /100 | #308 | Tragic 13.5% |
| Tlingit-Haida | 0.0 /100 | #309 | Tragic 13.5% |
| Blackfeet | 0.0 /100 | #310 | Tragic 13.6% |
| Delaware | 0.0 /100 | #311 | Tragic 13.6% |
| Spanish Americans | 0.0 /100 | #312 | Tragic 13.6% |
French Canadian Disability Correlation Summary
| Measurement | French Canadian Data | Disability Data |
| Minimum | 0.21% | 1.9% |
| Maximum | 100.0% | 37.2% |
| Range | 99.8% | 35.3% |
| Mean | 24.8% | 16.7% |
| Median | 22.0% | 15.3% |
| Interquartile 25% (IQ1) | 11.0% | 13.4% |
| Interquartile 75% (IQ3) | 35.0% | 19.7% |
| Interquartile Range (IQR) | 24.0% | 6.3% |
| Standard Deviation (Sample) | 18.1% | 6.7% |
| Standard Deviation (Population) | 18.0% | 6.6% |
Correlation Details
| French Canadian Percentile | Sample Size | Disability |
[ 0.0% - 0.5% ] 0.21% | 363,540,577 | 12.2% |
[ 0.5% - 1.0% ] 0.68% | 81,871,462 | 12.7% |
[ 1.0% - 1.5% ] 1.21% | 22,497,646 | 13.6% |
[ 1.5% - 2.0% ] 1.73% | 9,700,438 | 13.5% |
[ 2.0% - 2.5% ] 2.24% | 5,783,739 | 13.3% |
[ 2.5% - 3.0% ] 2.71% | 3,497,479 | 14.0% |
[ 3.0% - 3.5% ] 3.26% | 2,730,471 | 13.5% |
[ 3.5% - 4.0% ] 3.75% | 2,055,721 | 13.4% |
[ 4.0% - 4.5% ] 4.23% | 1,531,908 | 14.7% |
[ 4.5% - 5.0% ] 4.75% | 1,219,629 | 14.6% |
[ 5.0% - 5.5% ] 5.27% | 1,017,941 | 13.8% |
[ 5.5% - 6.0% ] 5.72% | 798,089 | 14.0% |
[ 6.0% - 6.5% ] 6.24% | 920,219 | 14.7% |
[ 6.5% - 7.0% ] 6.72% | 681,038 | 13.4% |
[ 7.0% - 7.5% ] 7.21% | 725,699 | 14.8% |
[ 7.5% - 8.0% ] 7.72% | 528,381 | 13.3% |
[ 8.0% - 8.5% ] 8.24% | 743,543 | 14.7% |
[ 8.5% - 9.0% ] 8.76% | 236,253 | 14.6% |
[ 9.0% - 9.5% ] 9.26% | 354,758 | 15.9% |
[ 9.5% - 10.0% ] 9.66% | 221,923 | 13.5% |
[ 10.0% - 10.5% ] 10.27% | 373,411 | 14.1% |
[ 10.5% - 11.0% ] 10.77% | 280,882 | 15.1% |
[ 11.0% - 11.5% ] 11.26% | 129,964 | 16.3% |
[ 11.5% - 12.0% ] 11.79% | 75,338 | 13.8% |
[ 12.0% - 12.5% ] 12.26% | 126,077 | 14.7% |
[ 12.5% - 13.0% ] 12.74% | 256,886 | 18.0% |
[ 13.0% - 13.5% ] 13.17% | 39,673 | 16.6% |
[ 13.5% - 14.0% ] 13.74% | 39,140 | 13.1% |
[ 14.0% - 14.5% ] 14.24% | 103,106 | 15.2% |
[ 14.5% - 15.0% ] 14.72% | 69,988 | 14.4% |
[ 15.0% - 15.5% ] 15.16% | 23,600 | 15.4% |
[ 15.5% - 16.0% ] 15.76% | 63,415 | 15.4% |
[ 16.0% - 16.5% ] 16.27% | 36,944 | 15.5% |
[ 16.5% - 17.0% ] 16.65% | 30,880 | 23.1% |
[ 17.0% - 17.5% ] 17.11% | 50,532 | 19.1% |
[ 17.5% - 18.0% ] 17.71% | 11,192 | 15.6% |
[ 18.0% - 18.5% ] 18.25% | 21,901 | 17.4% |
[ 18.5% - 19.0% ] 18.93% | 97,128 | 18.6% |
[ 19.0% - 19.5% ] 19.29% | 24,672 | 16.4% |
[ 19.5% - 20.0% ] 19.77% | 1,502 | 24.7% |
[ 20.0% - 20.5% ] 20.35% | 16,866 | 17.9% |
[ 20.5% - 21.0% ] 20.80% | 8,665 | 14.5% |
[ 21.0% - 21.5% ] 21.35% | 5,779 | 13.0% |
[ 21.5% - 22.0% ] 21.86% | 2,553 | 17.0% |
[ 22.0% - 22.5% ] 22.19% | 1,361 | 15.9% |
[ 22.5% - 23.0% ] 22.83% | 1,323 | 9.0% |
[ 23.0% - 23.5% ] 23.27% | 1,981 | 19.2% |
[ 23.5% - 24.0% ] 23.70% | 637 | 37.2% |
[ 24.0% - 24.5% ] 24.18% | 2,457 | 11.2% |
[ 25.0% - 25.5% ] 25.00% | 48 | 6.2% |
[ 25.0% - 25.5% ] 25.37% | 6,776 | 18.7% |
[ 25.5% - 26.0% ] 25.76% | 330 | 20.0% |
[ 26.0% - 26.5% ] 26.32% | 3,104 | 21.7% |
[ 26.5% - 27.0% ] 26.92% | 78 | 34.6% |
[ 27.5% - 28.0% ] 27.82% | 1,693 | 12.6% |
[ 28.5% - 29.0% ] 28.74% | 609 | 7.7% |
[ 29.0% - 29.5% ] 29.23% | 544 | 21.5% |
[ 29.5% - 30.0% ] 29.57% | 947 | 19.0% |
[ 30.0% - 30.5% ] 30.38% | 339 | 5.0% |
[ 30.5% - 31.0% ] 30.88% | 408 | 24.8% |
[ 31.5% - 32.0% ] 31.96% | 219 | 27.9% |
[ 32.0% - 32.5% ] 32.23% | 667 | 20.4% |
[ 32.5% - 33.0% ] 32.77% | 946 | 34.2% |
[ 33.0% - 33.5% ] 33.13% | 483 | 21.5% |
[ 34.0% - 34.5% ] 34.02% | 388 | 5.9% |
[ 34.5% - 35.0% ] 34.98% | 3,190 | 26.8% |
[ 35.0% - 35.5% ] 35.11% | 131 | 16.8% |
[ 35.5% - 36.0% ] 35.66% | 2,883 | 27.4% |
[ 36.0% - 36.5% ] 36.47% | 340 | 27.6% |
[ 36.5% - 37.0% ] 36.52% | 994 | 12.4% |
[ 37.0% - 37.5% ] 37.21% | 129 | 29.5% |
[ 37.5% - 38.0% ] 37.63% | 1,116 | 22.4% |
[ 38.5% - 39.0% ] 38.61% | 101 | 21.8% |
[ 39.0% - 39.5% ] 39.30% | 1,603 | 8.2% |
[ 40.0% - 40.5% ] 40.38% | 416 | 14.4% |
[ 41.5% - 42.0% ] 41.88% | 394 | 24.4% |
[ 44.0% - 44.5% ] 44.44% | 72 | 20.8% |
[ 44.5% - 45.0% ] 44.55% | 110 | 21.8% |
[ 46.5% - 47.0% ] 46.70% | 576 | 8.0% |
[ 48.0% - 48.5% ] 48.25% | 286 | 5.9% |
[ 50.0% - 50.5% ] 50.36% | 137 | 16.1% |
[ 52.5% - 53.0% ] 52.83% | 53 | 17.0% |
[ 55.0% - 55.5% ] 55.41% | 915 | 13.2% |
[ 57.0% - 57.5% ] 57.15% | 1,398 | 10.3% |
[ 58.0% - 58.5% ] 58.09% | 346 | 4.0% |
[ 60.5% - 61.0% ] 60.58% | 728 | 1.9% |
[ 76.0% - 76.5% ] 76.31% | 325 | 19.4% |
[ 99.5% - 100.0% ] 100.00% | 34 | 32.4% |