French Canadian 3 or more Vehicles in Household
COMPARE
French Canadian
Select to Compare
3 or more Vehicles in Household
French Canadian 3 or more Vehicles in Household
20.6%
3+ VEHICLES AVAILABLE
95.0/ 100
METRIC RATING
115th/ 347
METRIC RANK
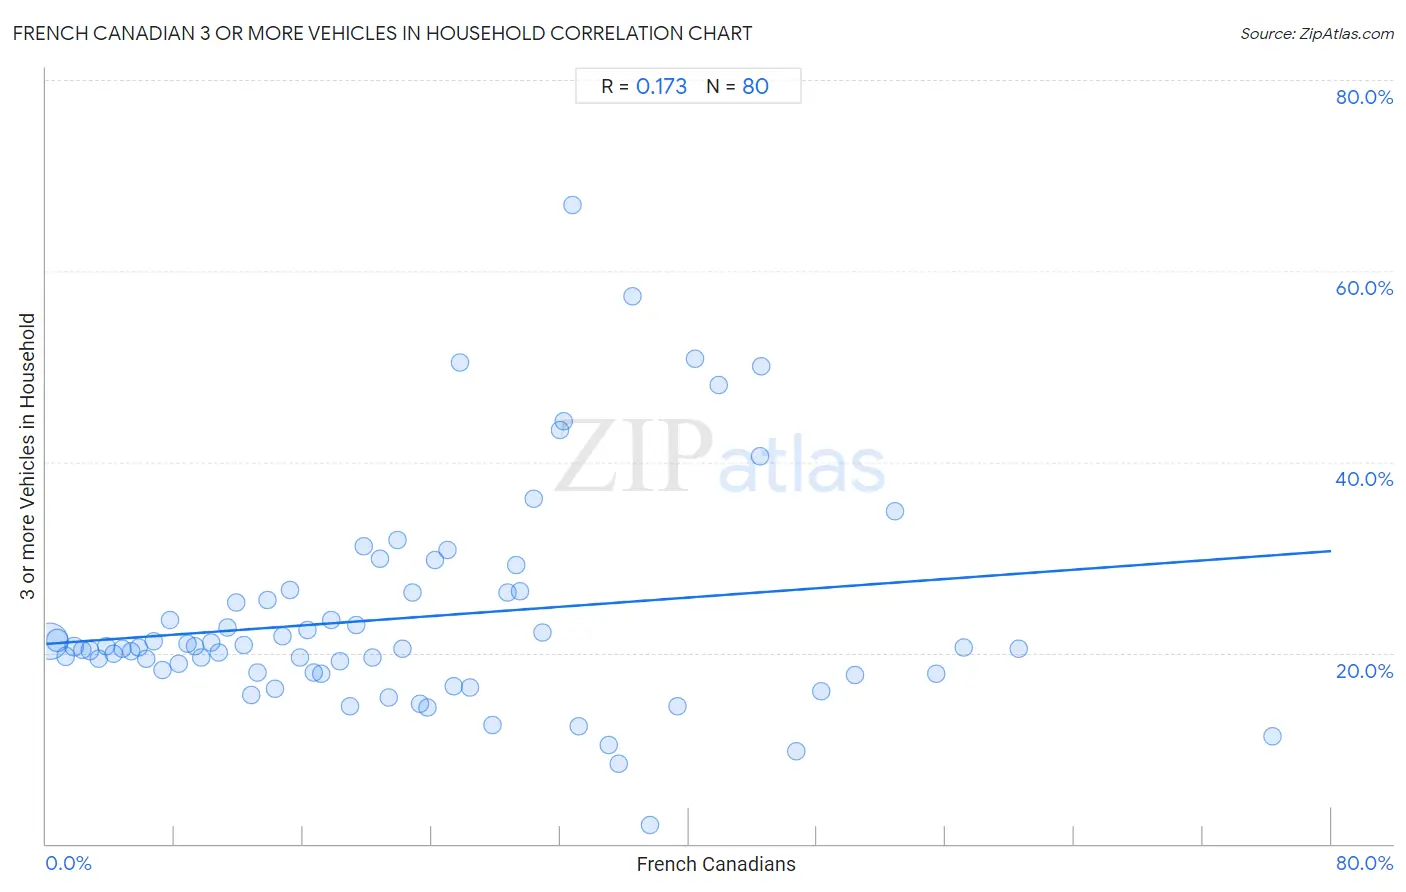
French Canadian 3 or more Vehicles in Household Correlation Chart
The statistical analysis conducted on geographies consisting of 502,103,809 people shows a poor positive correlation between the proportion of French Canadians and percentage of households with 3 or more vehicles available in the United States with a correlation coefficient (R) of 0.173 and weighted average of 20.6%. On average, for every 1% (one percent) increase in French Canadians within a typical geography, there is an increase of 0.12% in percentage of households with 3 or more vehicles available.
It is essential to understand that the correlation between the percentage of French Canadians and percentage of households with 3 or more vehicles available does not imply a direct cause-and-effect relationship. It remains uncertain whether the presence of French Canadians influences an upward or downward trend in the level of percentage of households with 3 or more vehicles available within an area, or if French Canadians simply ended up residing in those areas with higher or lower levels of percentage of households with 3 or more vehicles available due to other factors.
Demographics Similar to French Canadians by 3 or more Vehicles in Household
In terms of 3 or more vehicles in household, the demographic groups most similar to French Canadians are Italian (20.6%, a difference of 0.030%), Croatian (20.6%, a difference of 0.050%), Costa Rican (20.6%, a difference of 0.16%), Immigrants from Latin America (20.5%, a difference of 0.20%), and Burmese (20.6%, a difference of 0.31%).
| Demographics | Rating | Rank | 3 or more Vehicles in Household |
| Immigrants from Scotland | 97.1 /100 | #108 | Exceptional 20.8% |
| Filipinos | 97.0 /100 | #109 | Exceptional 20.8% |
| Asians | 96.8 /100 | #110 | Exceptional 20.8% |
| Immigrants from Micronesia | 96.7 /100 | #111 | Exceptional 20.7% |
| Nicaraguans | 96.2 /100 | #112 | Exceptional 20.7% |
| Immigrants from England | 96.2 /100 | #113 | Exceptional 20.7% |
| Burmese | 95.8 /100 | #114 | Exceptional 20.6% |
| French Canadians | 95.0 /100 | #115 | Exceptional 20.6% |
| Italians | 94.9 /100 | #116 | Exceptional 20.6% |
| Croatians | 94.9 /100 | #117 | Exceptional 20.6% |
| Costa Ricans | 94.6 /100 | #118 | Exceptional 20.6% |
| Immigrants from Latin America | 94.5 /100 | #119 | Exceptional 20.5% |
| Maltese | 93.9 /100 | #120 | Exceptional 20.5% |
| Immigrants from Thailand | 93.8 /100 | #121 | Exceptional 20.5% |
| German Russians | 93.7 /100 | #122 | Exceptional 20.5% |
French Canadian 3 or more Vehicles in Household Correlation Summary
| Measurement | French Canadian Data | 3 or more Vehicles in Household Data |
| Minimum | 0.21% | 2.0% |
| Maximum | 76.3% | 66.8% |
| Range | 76.1% | 64.8% |
| Mean | 22.7% | 23.7% |
| Median | 20.1% | 20.6% |
| Interquartile 25% (IQ1) | 10.0% | 17.9% |
| Interquartile 75% (IQ3) | 32.1% | 26.4% |
| Interquartile Range (IQR) | 22.1% | 8.5% |
| Standard Deviation (Sample) | 16.2% | 11.3% |
| Standard Deviation (Population) | 16.1% | 11.3% |
Correlation Details
| French Canadian Percentile | Sample Size | 3 or more Vehicles in Household |
[ 0.0% - 0.5% ] 0.21% | 363,335,473 | 21.2% |
[ 0.5% - 1.0% ] 0.68% | 81,735,451 | 21.3% |
[ 1.0% - 1.5% ] 1.21% | 22,434,584 | 19.7% |
[ 1.5% - 2.0% ] 1.73% | 9,675,811 | 20.7% |
[ 2.0% - 2.5% ] 2.24% | 5,764,299 | 20.3% |
[ 2.5% - 3.0% ] 2.71% | 3,490,819 | 20.2% |
[ 3.0% - 3.5% ] 3.26% | 2,718,486 | 19.4% |
[ 3.5% - 4.0% ] 3.75% | 2,050,672 | 20.7% |
[ 4.0% - 4.5% ] 4.23% | 1,530,233 | 19.9% |
[ 4.5% - 5.0% ] 4.75% | 1,219,184 | 20.4% |
[ 5.0% - 5.5% ] 5.27% | 1,015,724 | 20.1% |
[ 5.5% - 6.0% ] 5.72% | 798,667 | 20.6% |
[ 6.0% - 6.5% ] 6.24% | 917,832 | 19.3% |
[ 6.5% - 7.0% ] 6.72% | 680,070 | 21.2% |
[ 7.0% - 7.5% ] 7.21% | 725,458 | 18.3% |
[ 7.5% - 8.0% ] 7.72% | 528,088 | 23.4% |
[ 8.0% - 8.5% ] 8.24% | 743,588 | 18.9% |
[ 8.5% - 9.0% ] 8.76% | 236,053 | 20.9% |
[ 9.0% - 9.5% ] 9.26% | 354,431 | 20.6% |
[ 9.5% - 10.0% ] 9.66% | 221,944 | 19.5% |
[ 10.0% - 10.5% ] 10.27% | 373,572 | 21.0% |
[ 10.5% - 11.0% ] 10.77% | 280,920 | 20.0% |
[ 11.0% - 11.5% ] 11.26% | 129,964 | 22.7% |
[ 11.5% - 12.0% ] 11.79% | 75,288 | 25.2% |
[ 12.0% - 12.5% ] 12.26% | 125,279 | 20.8% |
[ 12.5% - 13.0% ] 12.74% | 256,886 | 15.6% |
[ 13.0% - 13.5% ] 13.17% | 39,673 | 18.0% |
[ 13.5% - 14.0% ] 13.74% | 39,140 | 25.5% |
[ 14.0% - 14.5% ] 14.24% | 100,922 | 16.2% |
[ 14.5% - 15.0% ] 14.72% | 70,297 | 21.7% |
[ 15.0% - 15.5% ] 15.16% | 23,600 | 26.6% |
[ 15.5% - 16.0% ] 15.76% | 62,681 | 19.5% |
[ 16.0% - 16.5% ] 16.27% | 36,944 | 22.5% |
[ 16.5% - 17.0% ] 16.65% | 30,880 | 17.9% |
[ 17.0% - 17.5% ] 17.11% | 50,503 | 17.8% |
[ 17.5% - 18.0% ] 17.71% | 11,192 | 23.4% |
[ 18.0% - 18.5% ] 18.25% | 21,901 | 19.1% |
[ 18.5% - 19.0% ] 18.93% | 97,058 | 14.4% |
[ 19.0% - 19.5% ] 19.29% | 24,672 | 22.9% |
[ 19.5% - 20.0% ] 19.77% | 1,502 | 31.1% |
[ 20.0% - 20.5% ] 20.35% | 17,053 | 19.5% |
[ 20.5% - 21.0% ] 20.80% | 8,393 | 29.9% |
[ 21.0% - 21.5% ] 21.35% | 5,779 | 15.3% |
[ 21.5% - 22.0% ] 21.86% | 2,498 | 31.8% |
[ 22.0% - 22.5% ] 22.19% | 1,361 | 20.5% |
[ 22.5% - 23.0% ] 22.82% | 1,626 | 26.3% |
[ 23.0% - 23.5% ] 23.27% | 1,981 | 14.7% |
[ 23.5% - 24.0% ] 23.70% | 637 | 14.2% |
[ 24.0% - 24.5% ] 24.18% | 2,457 | 29.7% |
[ 25.0% - 25.5% ] 25.00% | 96 | 30.8% |
[ 25.0% - 25.5% ] 25.37% | 6,681 | 16.5% |
[ 25.5% - 26.0% ] 25.73% | 443 | 50.4% |
[ 26.0% - 26.5% ] 26.35% | 3,727 | 16.4% |
[ 27.5% - 28.0% ] 27.82% | 1,693 | 12.5% |
[ 28.5% - 29.0% ] 28.74% | 609 | 26.4% |
[ 29.0% - 29.5% ] 29.24% | 554 | 29.2% |
[ 29.5% - 30.0% ] 29.51% | 427 | 26.5% |
[ 30.0% - 30.5% ] 30.38% | 339 | 36.2% |
[ 30.5% - 31.0% ] 30.89% | 327 | 22.1% |
[ 31.5% - 32.0% ] 31.96% | 219 | 43.3% |
[ 32.0% - 32.5% ] 32.24% | 608 | 44.3% |
[ 32.5% - 33.0% ] 32.78% | 1,022 | 66.8% |
[ 33.0% - 33.5% ] 33.15% | 540 | 12.3% |
[ 34.5% - 35.0% ] 34.98% | 3,190 | 10.3% |
[ 35.5% - 36.0% ] 35.66% | 2,883 | 8.4% |
[ 36.5% - 37.0% ] 36.52% | 994 | 57.4% |
[ 37.5% - 38.0% ] 37.61% | 997 | 2.0% |
[ 39.0% - 39.5% ] 39.30% | 1,524 | 14.4% |
[ 40.0% - 40.5% ] 40.38% | 416 | 50.9% |
[ 41.5% - 42.0% ] 41.88% | 394 | 48.0% |
[ 44.0% - 44.5% ] 44.44% | 72 | 40.5% |
[ 44.5% - 45.0% ] 44.55% | 110 | 50.0% |
[ 46.5% - 47.0% ] 46.70% | 576 | 9.7% |
[ 48.0% - 48.5% ] 48.25% | 286 | 16.0% |
[ 50.0% - 50.5% ] 50.36% | 137 | 17.6% |
[ 52.5% - 53.0% ] 52.83% | 53 | 34.8% |
[ 55.0% - 55.5% ] 55.41% | 915 | 17.8% |
[ 57.0% - 57.5% ] 57.15% | 1,398 | 20.6% |
[ 60.5% - 61.0% ] 60.58% | 728 | 20.4% |
[ 76.0% - 76.5% ] 76.31% | 325 | 11.3% |