French Canadian 2 or more Vehicles in Household
COMPARE
French Canadian
Select to Compare
2 or more Vehicles in Household
French Canadian 2 or more Vehicles in Household
58.9%
2+ VEHICLES AVAILABLE
99.8/ 100
METRIC RATING
60th/ 347
METRIC RANK
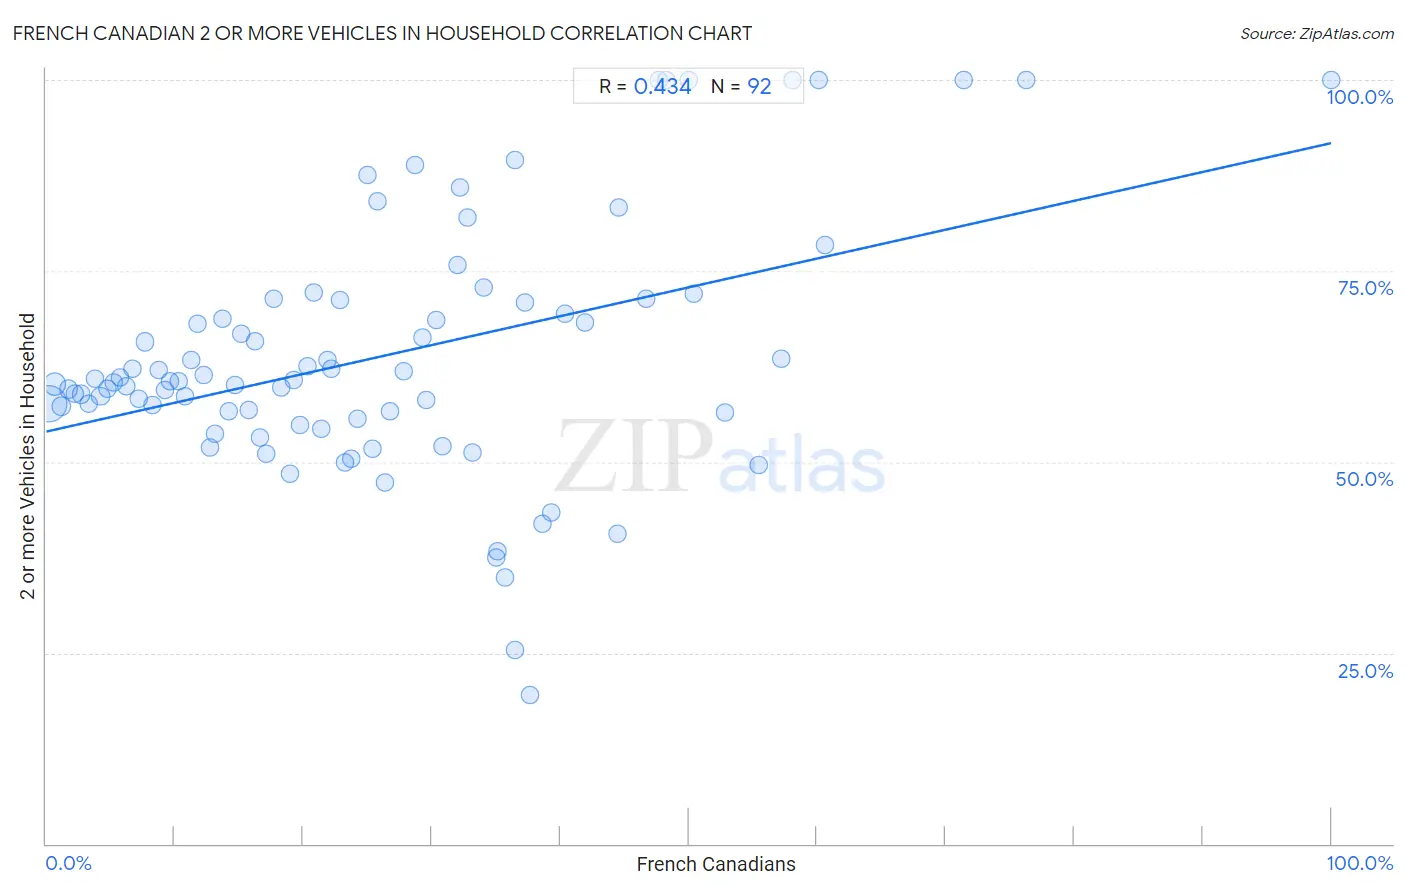
French Canadian 2 or more Vehicles in Household Correlation Chart
The statistical analysis conducted on geographies consisting of 502,331,363 people shows a moderate positive correlation between the proportion of French Canadians and percentage of households with 2 or more vehicles available in the United States with a correlation coefficient (R) of 0.434 and weighted average of 58.9%. On average, for every 1% (one percent) increase in French Canadians within a typical geography, there is an increase of 0.38% in percentage of households with 2 or more vehicles available.
It is essential to understand that the correlation between the percentage of French Canadians and percentage of households with 2 or more vehicles available does not imply a direct cause-and-effect relationship. It remains uncertain whether the presence of French Canadians influences an upward or downward trend in the level of percentage of households with 2 or more vehicles available within an area, or if French Canadians simply ended up residing in those areas with higher or lower levels of percentage of households with 2 or more vehicles available due to other factors.
Demographics Similar to French Canadians by 2 or more Vehicles in Household
In terms of 2 or more vehicles in household, the demographic groups most similar to French Canadians are Spanish American (58.9%, a difference of 0.030%), Immigrants from Scotland (58.9%, a difference of 0.050%), Osage (58.8%, a difference of 0.13%), Nonimmigrants (58.8%, a difference of 0.17%), and Afghan (59.0%, a difference of 0.23%).
| Demographics | Rating | Rank | 2 or more Vehicles in Household |
| Celtics | 99.9 /100 | #53 | Exceptional 59.2% |
| Bhutanese | 99.9 /100 | #54 | Exceptional 59.1% |
| Luxembourgers | 99.9 /100 | #55 | Exceptional 59.1% |
| Chickasaw | 99.9 /100 | #56 | Exceptional 59.0% |
| Afghans | 99.9 /100 | #57 | Exceptional 59.0% |
| Immigrants from Scotland | 99.8 /100 | #58 | Exceptional 58.9% |
| Spanish Americans | 99.8 /100 | #59 | Exceptional 58.9% |
| French Canadians | 99.8 /100 | #60 | Exceptional 58.9% |
| Osage | 99.8 /100 | #61 | Exceptional 58.8% |
| Nonimmigrants | 99.8 /100 | #62 | Exceptional 58.8% |
| Mexican American Indians | 99.8 /100 | #63 | Exceptional 58.7% |
| Portuguese | 99.7 /100 | #64 | Exceptional 58.6% |
| Immigrants from Central America | 99.7 /100 | #65 | Exceptional 58.6% |
| Croatians | 99.7 /100 | #66 | Exceptional 58.6% |
| Laotians | 99.7 /100 | #67 | Exceptional 58.6% |
French Canadian 2 or more Vehicles in Household Correlation Summary
| Measurement | French Canadian Data | 2 or more Vehicles in Household Data |
| Minimum | 0.21% | 19.5% |
| Maximum | 100.0% | 100.0% |
| Range | 99.8% | 80.5% |
| Mean | 26.2% | 63.9% |
| Median | 23.0% | 60.5% |
| Interquartile 25% (IQ1) | 11.5% | 56.1% |
| Interquartile 75% (IQ3) | 36.5% | 71.1% |
| Interquartile Range (IQR) | 25.0% | 15.0% |
| Standard Deviation (Sample) | 19.0% | 16.6% |
| Standard Deviation (Population) | 18.9% | 16.5% |
Correlation Details
| French Canadian Percentile | Sample Size | 2 or more Vehicles in Household |
[ 0.0% - 0.5% ] 0.21% | 363,411,483 | 57.5% |
[ 0.5% - 1.0% ] 0.68% | 81,806,677 | 60.2% |
[ 1.0% - 1.5% ] 1.21% | 22,461,856 | 57.3% |
[ 1.5% - 2.0% ] 1.73% | 9,694,194 | 59.5% |
[ 2.0% - 2.5% ] 2.24% | 5,772,310 | 59.0% |
[ 2.5% - 3.0% ] 2.71% | 3,492,493 | 58.9% |
[ 3.0% - 3.5% ] 3.26% | 2,725,654 | 57.7% |
[ 3.5% - 4.0% ] 3.75% | 2,053,871 | 60.8% |
[ 4.0% - 4.5% ] 4.23% | 1,530,969 | 58.6% |
[ 4.5% - 5.0% ] 4.75% | 1,219,551 | 59.6% |
[ 5.0% - 5.5% ] 5.27% | 1,016,670 | 60.4% |
[ 5.5% - 6.0% ] 5.72% | 798,754 | 61.0% |
[ 6.0% - 6.5% ] 6.24% | 920,474 | 59.9% |
[ 6.5% - 7.0% ] 6.72% | 681,217 | 62.3% |
[ 7.0% - 7.5% ] 7.21% | 725,798 | 58.2% |
[ 7.5% - 8.0% ] 7.72% | 528,381 | 65.7% |
[ 8.0% - 8.5% ] 8.24% | 743,780 | 57.5% |
[ 8.5% - 9.0% ] 8.76% | 236,288 | 62.1% |
[ 9.0% - 9.5% ] 9.26% | 354,758 | 59.4% |
[ 9.5% - 10.0% ] 9.66% | 221,944 | 60.5% |
[ 10.0% - 10.5% ] 10.27% | 373,698 | 60.5% |
[ 10.5% - 11.0% ] 10.77% | 280,920 | 58.6% |
[ 11.0% - 11.5% ] 11.26% | 129,964 | 63.3% |
[ 11.5% - 12.0% ] 11.79% | 75,338 | 68.1% |
[ 12.0% - 12.5% ] 12.26% | 126,159 | 61.4% |
[ 12.5% - 13.0% ] 12.74% | 256,886 | 51.8% |
[ 13.0% - 13.5% ] 13.17% | 39,673 | 53.7% |
[ 13.5% - 14.0% ] 13.74% | 39,140 | 68.8% |
[ 14.0% - 14.5% ] 14.24% | 103,106 | 56.6% |
[ 14.5% - 15.0% ] 14.72% | 70,297 | 60.1% |
[ 15.0% - 15.5% ] 15.16% | 23,600 | 66.7% |
[ 15.5% - 16.0% ] 15.76% | 63,415 | 56.8% |
[ 16.0% - 16.5% ] 16.27% | 36,944 | 65.8% |
[ 16.5% - 17.0% ] 16.65% | 30,928 | 53.2% |
[ 17.0% - 17.5% ] 17.11% | 50,532 | 51.1% |
[ 17.5% - 18.0% ] 17.71% | 11,192 | 71.3% |
[ 18.0% - 18.5% ] 18.25% | 21,901 | 59.7% |
[ 18.5% - 19.0% ] 18.93% | 97,128 | 48.4% |
[ 19.0% - 19.5% ] 19.29% | 24,708 | 60.7% |
[ 19.5% - 20.0% ] 19.77% | 1,502 | 54.8% |
[ 20.0% - 20.5% ] 20.35% | 17,053 | 62.5% |
[ 20.5% - 21.0% ] 20.80% | 8,582 | 72.2% |
[ 21.0% - 21.5% ] 21.35% | 5,779 | 54.4% |
[ 21.5% - 22.0% ] 21.86% | 2,553 | 63.4% |
[ 22.0% - 22.5% ] 22.19% | 1,361 | 62.2% |
[ 22.5% - 23.0% ] 22.82% | 1,626 | 71.3% |
[ 23.0% - 23.5% ] 23.27% | 1,981 | 49.9% |
[ 23.5% - 24.0% ] 23.70% | 637 | 50.5% |
[ 24.0% - 24.5% ] 24.18% | 2,457 | 55.7% |
[ 25.0% - 25.5% ] 25.00% | 96 | 87.5% |
[ 25.0% - 25.5% ] 25.37% | 6,681 | 51.6% |
[ 25.5% - 26.0% ] 25.75% | 532 | 84.1% |
[ 26.0% - 26.5% ] 26.35% | 3,727 | 47.3% |
[ 26.5% - 27.0% ] 26.77% | 127 | 56.6% |
[ 27.5% - 28.0% ] 27.82% | 1,693 | 61.9% |
[ 28.5% - 29.0% ] 28.73% | 644 | 88.9% |
[ 29.0% - 29.5% ] 29.24% | 554 | 66.4% |
[ 29.5% - 30.0% ] 29.57% | 947 | 58.0% |
[ 30.0% - 30.5% ] 30.38% | 339 | 68.6% |
[ 30.5% - 31.0% ] 30.88% | 408 | 52.1% |
[ 31.5% - 32.0% ] 31.96% | 219 | 75.7% |
[ 32.0% - 32.5% ] 32.23% | 667 | 85.9% |
[ 32.5% - 33.0% ] 32.78% | 1,022 | 82.0% |
[ 33.0% - 33.5% ] 33.15% | 540 | 51.2% |
[ 34.0% - 34.5% ] 34.02% | 388 | 72.8% |
[ 34.5% - 35.0% ] 34.98% | 3,190 | 37.5% |
[ 35.0% - 35.5% ] 35.11% | 131 | 38.3% |
[ 35.5% - 36.0% ] 35.66% | 2,883 | 34.8% |
[ 36.0% - 36.5% ] 36.47% | 340 | 25.3% |
[ 36.5% - 37.0% ] 36.52% | 994 | 89.4% |
[ 37.0% - 37.5% ] 37.21% | 129 | 70.9% |
[ 37.5% - 38.0% ] 37.63% | 1,116 | 19.5% |
[ 38.5% - 39.0% ] 38.61% | 101 | 41.8% |
[ 39.0% - 39.5% ] 39.30% | 1,524 | 43.4% |
[ 40.0% - 40.5% ] 40.38% | 416 | 69.4% |
[ 41.5% - 42.0% ] 41.88% | 394 | 68.2% |
[ 44.0% - 44.5% ] 44.44% | 72 | 40.5% |
[ 44.5% - 45.0% ] 44.55% | 110 | 83.3% |
[ 46.5% - 47.0% ] 46.70% | 576 | 71.4% |
[ 47.5% - 48.0% ] 47.62% | 21 | 100.0% |
[ 48.0% - 48.5% ] 48.25% | 286 | 100.0% |
[ 50.0% - 50.5% ] 50.00% | 76 | 100.0% |
[ 50.0% - 50.5% ] 50.36% | 137 | 72.1% |
[ 52.5% - 53.0% ] 52.83% | 53 | 56.5% |
[ 55.0% - 55.5% ] 55.41% | 915 | 49.6% |
[ 57.0% - 57.5% ] 57.15% | 1,398 | 63.4% |
[ 58.0% - 58.5% ] 58.09% | 346 | 100.0% |
[ 60.0% - 60.5% ] 60.07% | 283 | 100.0% |
[ 60.5% - 61.0% ] 60.58% | 728 | 78.5% |
[ 71.0% - 71.5% ] 71.43% | 14 | 100.0% |
[ 76.0% - 76.5% ] 76.31% | 325 | 100.0% |
[ 99.5% - 100.0% ] 100.00% | 39 | 100.0% |