Egyptian Wage/Income Gap

COMPARE

Egyptian
Race
Ancestry
AfghanAfricanAlaska NativeAlaskan AthabascanAlbanianAleutAlsatianAmericanApacheArabArapahoArgentineanArmenianAssyrian/Chaldean/SyriacAustralianAustrianBahamianBangladeshiBarbadianBasqueBelgianBelizeanBermudanBhutaneseBlackfeetBolivianBrazilianBritishBritish West IndianBulgarianBurmeseCajunCambodianCanadianCape VerdeanCarpatho RusynCelticCentral AmericanCentral American IndianCherokeeCheyenneChickasawChileanChineseChippewaChoctawColombianColvilleComancheCosta RicanCreeCreekCroatianCrowCubanCypriotCzechCzechoslovakianDanishDelawareDominicanDutchDutch West IndianEastern EuropeanEcuadorianEgyptianEnglishEstonianEthiopianEuropeanFijianFilipinoFinnishFrenchFrench American IndianFrench CanadianGermanGerman RussianGhanaianGreekGuamanian/ChamorroGuatemalanGuyaneseHaitianHmongHonduranHopiHoumaHungarianIcelanderIndian (Asian)IndonesianInupiatIranianIraqiIrishIroquoisIsraeliItalianJamaicanJapaneseJordanianKenyanKiowaKoreanLaotianLatvianLebaneseLiberianLithuanianLumbeeLuxembourgerMacedonianMalaysianMalteseMarshalleseMenomineeMexicanMexican American IndianMongolianMoroccanNative HawaiianNavajoNepaleseNew ZealanderNicaraguanNigerianNorthern EuropeanNorwegianOkinawanOsageOttawaPaiutePakistaniPalestinianPanamanianParaguayanPennsylvania GermanPeruvianPimaPolishPortuguesePotawatomiPuebloPuerto RicanPuget Sound SalishRomanianRussianSalvadoranSamoanScandinavianScotch-IrishScottishSeminoleSenegaleseSerbianShoshoneSierra LeoneanSiouxSlavicSlovakSloveneSomaliSouth AfricanSouth AmericanSouth American IndianSoviet UnionSpaniardSpanishSpanish AmericanSpanish American IndianSri LankanSubsaharan AfricanSudaneseSwedishSwissSyrianTaiwaneseThaiTlingit-HaidaTohono O'OdhamTonganTrinidadian and TobagonianTsimshianTurkishU.S. Virgin IslanderUgandanUkrainianUruguayanUteVenezuelanVietnameseWelshWest IndianYakamaYaquiYugoslavianYumanYup'ikZimbabwean
Immigration
NonimmigrantsImmigrantsAfghanistanAfricaAlbaniaArgentinaArmeniaAsiaAustraliaAustriaBahamasBangladeshBarbadosBelarusBelgiumBelizeBoliviaBosnia and HerzegovinaBrazilBulgariaBurma/MyanmarCabo VerdeCambodiaCameroonCanadaCaribbeanCentral AmericaChileChinaColombiaCongoCosta RicaCroatiaCubaCzechoslovakiaDenmarkDominicaDominican RepublicEastern AfricaEastern AsiaEastern EuropeEcuadorEgyptEl SalvadorEnglandEritreaEthiopiaEuropeFijiFranceGermanyGhanaGreeceGrenadaGuatemalaGuyanaHaitiHondurasHong KongHungaryIndiaIndonesiaIranIraqIrelandIsraelItalyJamaicaJapanJordanKazakhstanKenyaKoreaKuwaitLaosLatin AmericaLatviaLebanonLiberiaLithuaniaMalaysiaMexicoMicronesiaMiddle AfricaMoldovaMoroccoNepalNetherlandsNicaraguaNigeriaNorth AmericaNorth MacedoniaNorthern AfricaNorthern EuropeNorwayOceaniaPakistanPanamaPeruPhilippinesPolandPortugalRomaniaRussiaSaudi ArabiaScotlandSenegalSerbiaSierra LeoneSingaporeSomaliaSouth AfricaSouth AmericaSouth Central AsiaSouth Eastern AsiaSouthern EuropeSpainSri LankaSt. Vincent and the GrenadinesSudanSwedenSwitzerlandSyriaTaiwanThailandTrinidad and TobagoTurkeyUgandaUkraineUruguayUzbekistanVenezuelaVietnamWest IndiesWestern AfricaWestern AsiaWestern EuropeYemenZaireZimbabweAzores
Select to Compare
Race
Ancestry
AfghanAfricanAlaska NativeAlaskan AthabascanAlbanianAleutAlsatianAmericanApacheArabArapahoArgentineanArmenianAssyrian/Chaldean/SyriacAustralianAustrianBahamianBangladeshiBarbadianBasqueBelgianBelizeanBermudanBhutaneseBlackfeetBolivianBrazilianBritishBritish West IndianBulgarianBurmeseCajunCambodianCanadianCape VerdeanCarpatho RusynCelticCentral AmericanCentral American IndianCherokeeCheyenneChickasawChileanChineseChippewaChoctawColombianColvilleComancheCosta RicanCreeCreekCroatianCrowCubanCypriotCzechCzechoslovakianDanishDelawareDominicanDutchDutch West IndianEastern EuropeanEcuadorianEnglishEstonianEthiopianEuropeanFijianFilipinoFinnishFrenchFrench American IndianFrench CanadianGermanGerman RussianGhanaianGreekGuamanian/ChamorroGuatemalanGuyaneseHaitianHmongHonduranHopiHoumaHungarianIcelanderIndian (Asian)IndonesianInupiatIranianIraqiIrishIroquoisIsraeliItalianJamaicanJapaneseJordanianKenyanKiowaKoreanLaotianLatvianLebaneseLiberianLithuanianLumbeeLuxembourgerMacedonianMalaysianMalteseMarshalleseMenomineeMexicanMexican American IndianMongolianMoroccanNative HawaiianNavajoNepaleseNew ZealanderNicaraguanNigerianNorthern EuropeanNorwegianOkinawanOsageOttawaPaiutePakistaniPalestinianPanamanianParaguayanPennsylvania GermanPeruvianPimaPolishPortuguesePotawatomiPuebloPuerto RicanPuget Sound SalishRomanianRussianSalvadoranSamoanScandinavianScotch-IrishScottishSeminoleSenegaleseSerbianShoshoneSierra LeoneanSiouxSlavicSlovakSloveneSomaliSouth AfricanSouth AmericanSouth American IndianSoviet UnionSpaniardSpanishSpanish AmericanSpanish American IndianSri LankanSubsaharan AfricanSudaneseSwedishSwissSyrianTaiwaneseThaiTlingit-HaidaTohono O'OdhamTonganTrinidadian and TobagonianTsimshianTurkishU.S. Virgin IslanderUgandanUkrainianUruguayanUteVenezuelanVietnameseWelshWest IndianYakamaYaquiYugoslavianYumanYup'ikZimbabwean
Immigration
NonimmigrantsImmigrantsAfghanistanAfricaAlbaniaArgentinaArmeniaAsiaAustraliaAustriaBahamasBangladeshBarbadosBelarusBelgiumBelizeBoliviaBosnia and HerzegovinaBrazilBulgariaBurma/MyanmarCabo VerdeCambodiaCameroonCanadaCaribbeanCentral AmericaChileChinaColombiaCongoCosta RicaCroatiaCubaCzechoslovakiaDenmarkDominicaDominican RepublicEastern AfricaEastern AsiaEastern EuropeEcuadorEgyptEl SalvadorEnglandEritreaEthiopiaEuropeFijiFranceGermanyGhanaGreeceGrenadaGuatemalaGuyanaHaitiHondurasHong KongHungaryIndiaIndonesiaIranIraqIrelandIsraelItalyJamaicaJapanJordanKazakhstanKenyaKoreaKuwaitLaosLatin AmericaLatviaLebanonLiberiaLithuaniaMalaysiaMexicoMicronesiaMiddle AfricaMoldovaMoroccoNepalNetherlandsNicaraguaNigeriaNorth AmericaNorth MacedoniaNorthern AfricaNorthern EuropeNorwayOceaniaPakistanPanamaPeruPhilippinesPolandPortugalRomaniaRussiaSaudi ArabiaScotlandSenegalSerbiaSierra LeoneSingaporeSomaliaSouth AfricaSouth AmericaSouth Central AsiaSouth Eastern AsiaSouthern EuropeSpainSri LankaSt. Vincent and the GrenadinesSudanSwedenSwitzerlandSyriaTaiwanThailandTrinidad and TobagoTurkeyUgandaUkraineUruguayUzbekistanVenezuelaVietnamWest IndiesWestern AfricaWestern AsiaWestern EuropeYemenZaireZimbabweAzores
Wage/Income Gap
Income
Poverty
Unemployment
Labor Participation
Family Structure
Vehicle Availability
Education Level
Disability

Egyptian Wage/Income Gap
Poor

26.6%
WAGE/INCOME GAP
12.7/ 100
METRIC RATING
208th/ 347
METRIC RANK

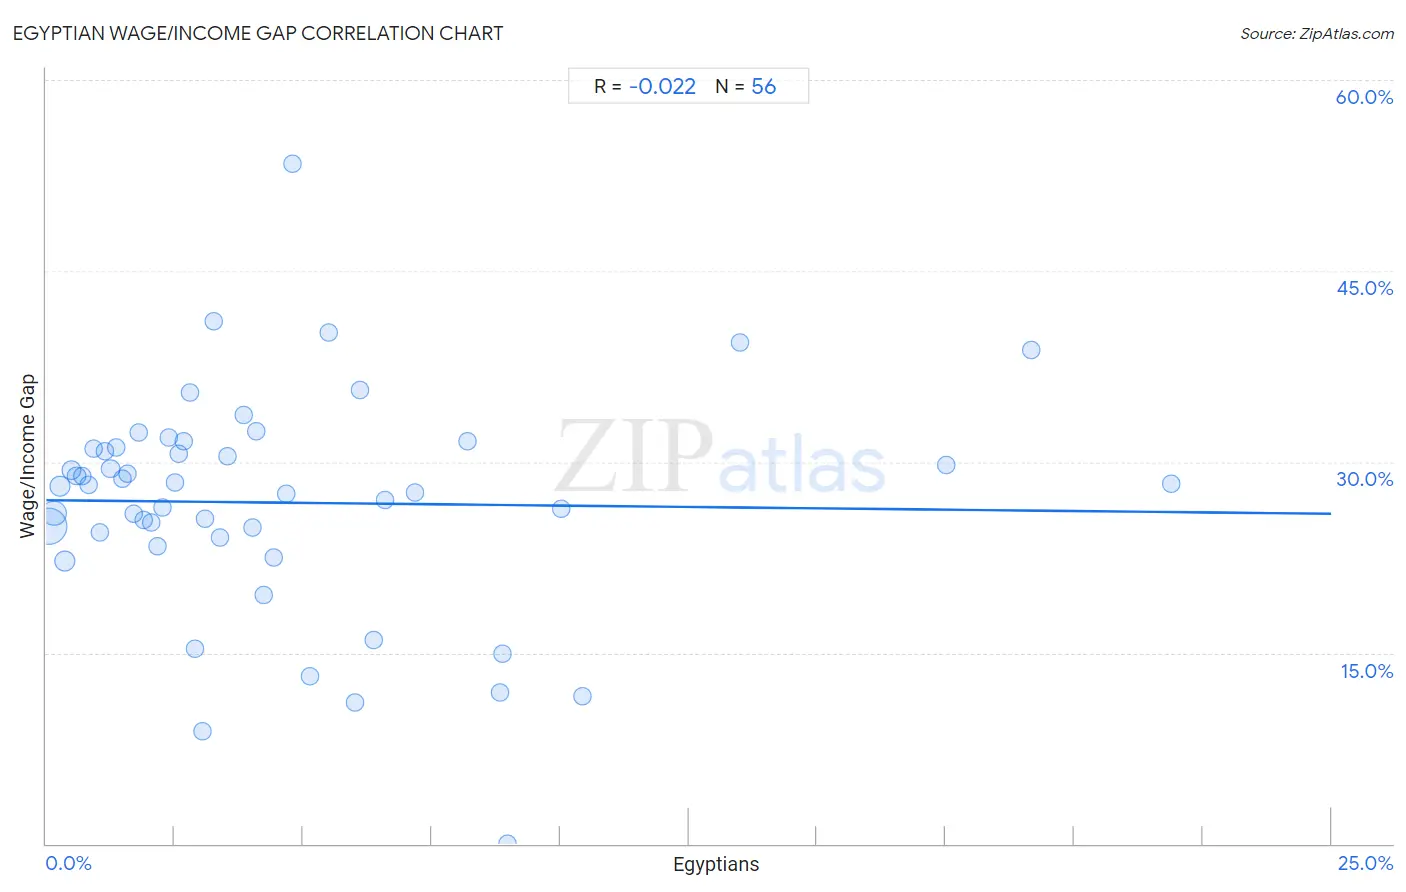
Egyptian Wage/Income Gap Correlation Chart

The statistical analysis conducted on geographies consisting of 276,865,878 people shows no correlation between the proportion of Egyptians and wage/income gap percentage in the United States with a correlation coefficient (R) of -0.022 and weighted average of 26.6%. On average, for every 1% (one percent) increase in Egyptians within a typical geography, there is a decrease of 0.042% in wage/income gap percentage.
Egyptian Wage/Income Gap
It is essential to understand that the correlation between the percentage of Egyptians and wage/income gap percentage does not imply a direct cause-and-effect relationship. It remains uncertain whether the presence of Egyptians influences an upward or downward trend in the level of wage/income gap percentage within an area, or if Egyptians simply ended up residing in those areas with higher or lower levels of wage/income gap percentage due to other factors.

Demographics Similar to Egyptians by Wage/Income Gap

In terms of wage/income gap, the demographic groups most similar to Egyptians are Immigrants from Kuwait (26.6%, a difference of 0.020%), Arab (26.6%, a difference of 0.060%), Mongolian (26.6%, a difference of 0.19%), Iraqi (26.6%, a difference of 0.22%), and Immigrants from Iraq (26.7%, a difference of 0.37%).
DemographicsRating | RankWage/Income Gap
Immigrants from Syria
19.3
/100
|
#201
Poor
26.4%
Laotians
19.2
/100
|
#202
Poor
26.4%
Immigrants from Eastern Europe
19.2
/100
|
#203
Poor
26.4%
Immigrants from Russia
19.0
/100
|
#204
Poor
26.4%
Immigrants from Southern Europe
17.3
/100
|
#205
Poor
26.4%
Indians (Asian)
16.5
/100
|
#206
Poor
26.4%
Immigrants from Italy
15.8
/100
|
#207
Poor
26.5%
Egyptians
12.7
/100
|
#208
Poor
26.6%
Immigrants from Kuwait
12.6
/100
|
#209
Poor
26.6%
Arabs
12.3
/100
|
#210
Poor
26.6%
Mongolians
11.4
/100
|
#211
Poor
26.6%
Iraqis
11.2
/100
|
#212
Poor
26.6%
Immigrants from Iraq
10.3
/100
|
#213
Poor
26.7%
Immigrants from China
10.3
/100
|
#214
Poor
26.7%
Yugoslavians
9.7
/100
|
#215
Tragic
26.7%

Egyptian Wage/Income Gap Correlation Summary

MeasurementEgyptian DataWage/Income Gap Data
Minimum0.048%0.012%
Maximum21.9%53.4%
Range21.8%53.4%
Mean4.6%26.8%
Median3.1%28.2%
Interquartile 25% (IQ1)1.5%24.3%
Interquartile 75% (IQ3)6.0%31.1%
Interquartile Range (IQR)4.5%6.8%
Standard Deviation (Sample)4.7%8.8%
Standard Deviation (Population)4.6%8.8%

Correlation Details

Egyptian PercentileSample SizeWage/Income Gap
[
0.0%
-
0.5%
]
0.048%
148,579,68324.9%
[
0.0%
-
0.5%
]
0.16%
57,354,57826.0%
[
0.0%
-
0.5%
]
0.27%
20,139,48228.1%
[
0.0%
-
0.5%
]
0.36%
22,776,75722.2%
[
0.0%
-
0.5%
]
0.49%
7,454,94929.3%
[
0.5%
-
1.0%
]
0.60%
4,829,20928.9%
[
0.5%
-
1.0%
]
0.70%
3,225,82628.9%
[
0.5%
-
1.0%
]
0.82%
2,408,98128.2%
[
0.5%
-
1.0%
]
0.93%
1,797,09131.1%
[
1.0%
-
1.5%
]
1.04%
1,982,57824.5%
[
1.0%
-
1.5%
]
1.14%
856,55930.8%
[
1.0%
-
1.5%
]
1.25%
673,31829.5%
[
1.0%
-
1.5%
]
1.35%
775,90731.2%
[
1.0%
-
1.5%
]
1.48%
389,44828.7%
[
1.5%
-
2.0%
]
1.59%
418,47829.1%
[
1.5%
-
2.0%
]
1.69%
513,25625.9%
[
1.5%
-
2.0%
]
1.80%
290,41932.3%
[
1.5%
-
2.0%
]
1.89%
742,84525.5%
[
2.0%
-
2.5%
]
2.04%
262,18325.2%
[
2.0%
-
2.5%
]
2.16%
122,07423.4%
[
2.0%
-
2.5%
]
2.27%
28,02326.4%
[
2.0%
-
2.5%
]
2.37%
77,57031.9%
[
2.5%
-
3.0%
]
2.51%
9,25528.3%
[
2.5%
-
3.0%
]
2.58%
159,60730.7%
[
2.5%
-
3.0%
]
2.66%
145,75631.6%
[
2.5%
-
3.0%
]
2.79%
96,43435.5%
[
2.5%
-
3.0%
]
2.89%
2,38515.3%
[
3.0%
-
3.5%
]
3.03%
77,9138.9%
[
3.0%
-
3.5%
]
3.10%
113,56925.6%
[
3.0%
-
3.5%
]
3.25%
9,59641.0%
[
3.0%
-
3.5%
]
3.38%
5,44424.1%
[
3.5%
-
4.0%
]
3.53%
18,67330.4%
[
3.5%
-
4.0%
]
3.83%
58,05333.7%
[
4.0%
-
4.5%
]
4.02%
4,25324.8%
[
4.0%
-
4.5%
]
4.09%
60,30332.4%
[
4.0%
-
4.5%
]
4.22%
13,07019.6%
[
4.0%
-
4.5%
]
4.44%
36,82322.5%
[
4.5%
-
5.0%
]
4.67%
52,23027.5%
[
4.5%
-
5.0%
]
4.79%
4,78253.4%
[
5.0%
-
5.5%
]
5.13%
99,80013.1%
[
5.0%
-
5.5%
]
5.49%
60140.2%
[
5.5%
-
6.0%
]
5.99%
3,55311.1%
[
6.0%
-
6.5%
]
6.10%
6,95235.6%
[
6.0%
-
6.5%
]
6.36%
14,51816.0%
[
6.5%
-
7.0%
]
6.59%
8,41027.0%
[
7.0%
-
7.5%
]
7.17%
7,01727.6%
[
8.0%
-
8.5%
]
8.20%
140,99431.6%
[
8.5%
-
9.0%
]
8.83%
1,15511.9%
[
8.5%
-
9.0%
]
8.89%
1,42914.9%
[
8.5%
-
9.0%
]
8.97%
7470.012%
[
10.0%
-
10.5%
]
10.02%
5,75126.3%
[
10.0%
-
10.5%
]
10.44%
5,00011.6%
[
13.0%
-
13.5%
]
13.49%
1,39439.3%
[
17.0%
-
17.5%
]
17.50%
12029.8%
[
19.0%
-
19.5%
]
19.16%
98138.8%
[
21.5%
-
22.0%
]
21.88%
9628.3%