Egyptian Unemployment Among Women with Children Ages 6 to 17 years

COMPARE

Egyptian
Race
Ancestry
AfghanAfricanAlaska NativeAlaskan AthabascanAlbanianAleutAlsatianAmericanApacheArabArapahoArgentineanArmenianAssyrian/Chaldean/SyriacAustralianAustrianBahamianBangladeshiBarbadianBasqueBelgianBelizeanBermudanBhutaneseBlackfeetBolivianBrazilianBritishBritish West IndianBulgarianBurmeseCajunCambodianCanadianCape VerdeanCarpatho RusynCelticCentral AmericanCentral American IndianCherokeeCheyenneChickasawChileanChineseChippewaChoctawColombianColvilleComancheCosta RicanCreeCreekCroatianCrowCubanCypriotCzechCzechoslovakianDanishDelawareDominicanDutchDutch West IndianEastern EuropeanEcuadorianEgyptianEnglishEstonianEthiopianEuropeanFijianFilipinoFinnishFrenchFrench American IndianFrench CanadianGermanGerman RussianGhanaianGreekGuamanian/ChamorroGuatemalanGuyaneseHaitianHmongHonduranHopiHoumaHungarianIcelanderIndian (Asian)IndonesianInupiatIranianIraqiIrishIroquoisIsraeliItalianJamaicanJapaneseJordanianKenyanKiowaKoreanLaotianLatvianLebaneseLiberianLithuanianLumbeeLuxembourgerMacedonianMalaysianMalteseMarshalleseMenomineeMexicanMexican American IndianMongolianMoroccanNative HawaiianNavajoNepaleseNew ZealanderNicaraguanNigerianNorthern EuropeanNorwegianOkinawanOsageOttawaPaiutePakistaniPalestinianPanamanianParaguayanPennsylvania GermanPeruvianPimaPolishPortuguesePotawatomiPuebloPuerto RicanPuget Sound SalishRomanianRussianSalvadoranSamoanScandinavianScotch-IrishScottishSeminoleSenegaleseSerbianShoshoneSierra LeoneanSiouxSlavicSlovakSloveneSomaliSouth AfricanSouth AmericanSouth American IndianSoviet UnionSpaniardSpanishSpanish AmericanSpanish American IndianSri LankanSubsaharan AfricanSudaneseSwedishSwissSyrianTaiwaneseThaiTlingit-HaidaTohono O'OdhamTonganTrinidadian and TobagonianTsimshianTurkishU.S. Virgin IslanderUgandanUkrainianUruguayanUteVenezuelanVietnameseWelshWest IndianYakamaYaquiYugoslavianYumanYup'ikZimbabwean
Immigration
NonimmigrantsImmigrantsAfghanistanAfricaAlbaniaArgentinaArmeniaAsiaAustraliaAustriaBahamasBangladeshBarbadosBelarusBelgiumBelizeBoliviaBosnia and HerzegovinaBrazilBulgariaBurma/MyanmarCabo VerdeCambodiaCameroonCanadaCaribbeanCentral AmericaChileChinaColombiaCongoCosta RicaCroatiaCubaCzechoslovakiaDenmarkDominicaDominican RepublicEastern AfricaEastern AsiaEastern EuropeEcuadorEgyptEl SalvadorEnglandEritreaEthiopiaEuropeFijiFranceGermanyGhanaGreeceGrenadaGuatemalaGuyanaHaitiHondurasHong KongHungaryIndiaIndonesiaIranIraqIrelandIsraelItalyJamaicaJapanJordanKazakhstanKenyaKoreaKuwaitLaosLatin AmericaLatviaLebanonLiberiaLithuaniaMalaysiaMexicoMicronesiaMiddle AfricaMoldovaMoroccoNepalNetherlandsNicaraguaNigeriaNorth AmericaNorth MacedoniaNorthern AfricaNorthern EuropeNorwayOceaniaPakistanPanamaPeruPhilippinesPolandPortugalRomaniaRussiaSaudi ArabiaScotlandSenegalSerbiaSierra LeoneSingaporeSomaliaSouth AfricaSouth AmericaSouth Central AsiaSouth Eastern AsiaSouthern EuropeSpainSri LankaSt. Vincent and the GrenadinesSudanSwedenSwitzerlandSyriaTaiwanThailandTrinidad and TobagoTurkeyUgandaUkraineUruguayUzbekistanVenezuelaVietnamWest IndiesWestern AfricaWestern AsiaWestern EuropeYemenZaireZimbabweAzores
Select to Compare
Race
Ancestry
AfghanAfricanAlaska NativeAlaskan AthabascanAlbanianAleutAlsatianAmericanApacheArabArapahoArgentineanArmenianAssyrian/Chaldean/SyriacAustralianAustrianBahamianBangladeshiBarbadianBasqueBelgianBelizeanBermudanBhutaneseBlackfeetBolivianBrazilianBritishBritish West IndianBulgarianBurmeseCajunCambodianCanadianCape VerdeanCarpatho RusynCelticCentral AmericanCentral American IndianCherokeeCheyenneChickasawChileanChineseChippewaChoctawColombianColvilleComancheCosta RicanCreeCreekCroatianCrowCubanCypriotCzechCzechoslovakianDanishDelawareDominicanDutchDutch West IndianEastern EuropeanEcuadorianEnglishEstonianEthiopianEuropeanFijianFilipinoFinnishFrenchFrench American IndianFrench CanadianGermanGerman RussianGhanaianGreekGuamanian/ChamorroGuatemalanGuyaneseHaitianHmongHonduranHopiHoumaHungarianIcelanderIndian (Asian)IndonesianInupiatIranianIraqiIrishIroquoisIsraeliItalianJamaicanJapaneseJordanianKenyanKiowaKoreanLaotianLatvianLebaneseLiberianLithuanianLumbeeLuxembourgerMacedonianMalaysianMalteseMarshalleseMenomineeMexicanMexican American IndianMongolianMoroccanNative HawaiianNavajoNepaleseNew ZealanderNicaraguanNigerianNorthern EuropeanNorwegianOkinawanOsageOttawaPaiutePakistaniPalestinianPanamanianParaguayanPennsylvania GermanPeruvianPimaPolishPortuguesePotawatomiPuebloPuerto RicanPuget Sound SalishRomanianRussianSalvadoranSamoanScandinavianScotch-IrishScottishSeminoleSenegaleseSerbianShoshoneSierra LeoneanSiouxSlavicSlovakSloveneSomaliSouth AfricanSouth AmericanSouth American IndianSoviet UnionSpaniardSpanishSpanish AmericanSpanish American IndianSri LankanSubsaharan AfricanSudaneseSwedishSwissSyrianTaiwaneseThaiTlingit-HaidaTohono O'OdhamTonganTrinidadian and TobagonianTsimshianTurkishU.S. Virgin IslanderUgandanUkrainianUruguayanUteVenezuelanVietnameseWelshWest IndianYakamaYaquiYugoslavianYumanYup'ikZimbabwean
Immigration
NonimmigrantsImmigrantsAfghanistanAfricaAlbaniaArgentinaArmeniaAsiaAustraliaAustriaBahamasBangladeshBarbadosBelarusBelgiumBelizeBoliviaBosnia and HerzegovinaBrazilBulgariaBurma/MyanmarCabo VerdeCambodiaCameroonCanadaCaribbeanCentral AmericaChileChinaColombiaCongoCosta RicaCroatiaCubaCzechoslovakiaDenmarkDominicaDominican RepublicEastern AfricaEastern AsiaEastern EuropeEcuadorEgyptEl SalvadorEnglandEritreaEthiopiaEuropeFijiFranceGermanyGhanaGreeceGrenadaGuatemalaGuyanaHaitiHondurasHong KongHungaryIndiaIndonesiaIranIraqIrelandIsraelItalyJamaicaJapanJordanKazakhstanKenyaKoreaKuwaitLaosLatin AmericaLatviaLebanonLiberiaLithuaniaMalaysiaMexicoMicronesiaMiddle AfricaMoldovaMoroccoNepalNetherlandsNicaraguaNigeriaNorth AmericaNorth MacedoniaNorthern AfricaNorthern EuropeNorwayOceaniaPakistanPanamaPeruPhilippinesPolandPortugalRomaniaRussiaSaudi ArabiaScotlandSenegalSerbiaSierra LeoneSingaporeSomaliaSouth AfricaSouth AmericaSouth Central AsiaSouth Eastern AsiaSouthern EuropeSpainSri LankaSt. Vincent and the GrenadinesSudanSwedenSwitzerlandSyriaTaiwanThailandTrinidad and TobagoTurkeyUgandaUkraineUruguayUzbekistanVenezuelaVietnamWest IndiesWestern AfricaWestern AsiaWestern EuropeYemenZaireZimbabweAzores
Unemployment Among Women with Children Ages 6 to 17 years
Income
Poverty
Unemployment
Labor Participation
Family Structure
Vehicle Availability
Education Level
Disability

Egyptian Unemployment Among Women with Children Ages 6 to 17 years
Exceptional

8.7%
UNEMPLOYMENT | WOMEN W/ CHILDREN 6 TO 17
91.8/ 100
METRIC RATING
133rd/ 347
METRIC RANK

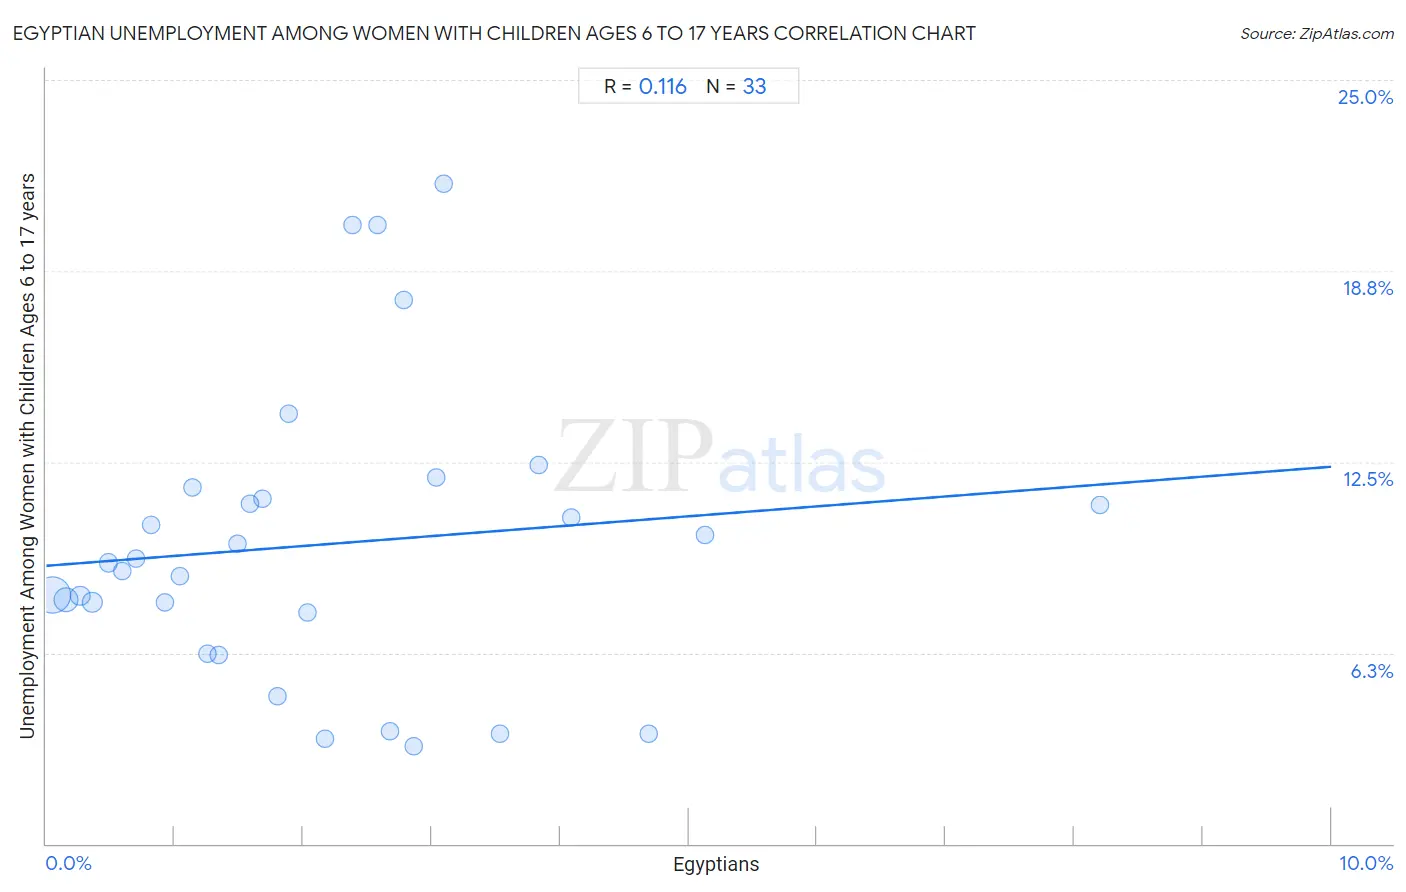
Egyptian Unemployment Among Women with Children Ages 6 to 17 years Correlation Chart

The statistical analysis conducted on geographies consisting of 213,857,106 people shows a poor positive correlation between the proportion of Egyptians and unemployment rate among women with children between the ages 6 and 17 in the United States with a correlation coefficient (R) of 0.116 and weighted average of 8.7%. On average, for every 1% (one percent) increase in Egyptians within a typical geography, there is an increase of 0.32% in unemployment rate among women with children between the ages 6 and 17.
Egyptian Unemployment Among Women with Children Ages 6 to 17 years
It is essential to understand that the correlation between the percentage of Egyptians and unemployment rate among women with children between the ages 6 and 17 does not imply a direct cause-and-effect relationship. It remains uncertain whether the presence of Egyptians influences an upward or downward trend in the level of unemployment rate among women with children between the ages 6 and 17 within an area, or if Egyptians simply ended up residing in those areas with higher or lower levels of unemployment rate among women with children between the ages 6 and 17 due to other factors.

Demographics Similar to Egyptians by Unemployment Among Women with Children Ages 6 to 17 years

In terms of unemployment among women with children ages 6 to 17 years, the demographic groups most similar to Egyptians are Yaqui (8.7%, a difference of 0.060%), Slavic (8.7%, a difference of 0.070%), Immigrants from Ireland (8.7%, a difference of 0.11%), European (8.7%, a difference of 0.17%), and Immigrants from Latvia (8.7%, a difference of 0.20%).
DemographicsRating | RankUnemployment Among Women with Children Ages 6 to 17 years
Immigrants from Northern Africa
94.4
/100
|
#126
Exceptional
8.7%
Czechs
94.4
/100
|
#127
Exceptional
8.7%
Hmong
94.3
/100
|
#128
Exceptional
8.7%
Barbadians
93.8
/100
|
#129
Exceptional
8.7%
Immigrants from Western Asia
93.1
/100
|
#130
Exceptional
8.7%
Slavs
92.2
/100
|
#131
Exceptional
8.7%
Yaqui
92.2
/100
|
#132
Exceptional
8.7%
Egyptians
91.8
/100
|
#133
Exceptional
8.7%
Immigrants from Ireland
91.0
/100
|
#134
Exceptional
8.7%
Europeans
90.6
/100
|
#135
Exceptional
8.7%
Immigrants from Latvia
90.4
/100
|
#136
Exceptional
8.7%
Immigrants from Argentina
90.0
/100
|
#137
Excellent
8.7%
Immigrants from Ethiopia
89.5
/100
|
#138
Excellent
8.8%
Northern Europeans
89.2
/100
|
#139
Excellent
8.8%
Immigrants from Poland
88.3
/100
|
#140
Excellent
8.8%

Egyptian Unemployment Among Women with Children Ages 6 to 17 years Correlation Summary

MeasurementEgyptian DataUnemployment Among Women with Children Ages 6 to 17 years Data
Minimum0.048%3.2%
Maximum8.2%21.6%
Range8.2%18.4%
Mean2.1%9.8%
Median1.8%9.2%
Interquartile 25% (IQ1)0.87%6.9%
Interquartile 75% (IQ3)2.9%11.5%
Interquartile Range (IQR)2.1%4.6%
Standard Deviation (Sample)1.7%4.8%
Standard Deviation (Population)1.7%4.7%

Correlation Details

Egyptian PercentileSample SizeUnemployment Among Women with Children Ages 6 to 17 years
[
0.0%
-
0.5%
]
0.048%
121,181,6938.2%
[
0.0%
-
0.5%
]
0.15%
43,307,5918.0%
[
0.0%
-
0.5%
]
0.27%
13,597,9138.1%
[
0.0%
-
0.5%
]
0.36%
18,729,3047.9%
[
0.0%
-
0.5%
]
0.48%
4,250,1359.2%
[
0.5%
-
1.0%
]
0.59%
2,585,9678.9%
[
0.5%
-
1.0%
]
0.70%
2,202,7839.3%
[
0.5%
-
1.0%
]
0.82%
1,515,99010.4%
[
0.5%
-
1.0%
]
0.93%
1,274,2537.9%
[
1.0%
-
1.5%
]
1.04%
1,497,5178.7%
[
1.0%
-
1.5%
]
1.13%
380,05611.7%
[
1.0%
-
1.5%
]
1.25%
413,4596.2%
[
1.0%
-
1.5%
]
1.35%
478,1526.2%
[
1.0%
-
1.5%
]
1.49%
235,4639.8%
[
1.5%
-
2.0%
]
1.59%
204,96011.1%
[
1.5%
-
2.0%
]
1.68%
206,22211.3%
[
1.5%
-
2.0%
]
1.80%
186,0694.8%
[
1.5%
-
2.0%
]
1.89%
549,21014.1%
[
2.0%
-
2.5%
]
2.03%
203,1037.6%
[
2.0%
-
2.5%
]
2.17%
109,2383.4%
[
2.0%
-
2.5%
]
2.38%
36,84720.3%
[
2.5%
-
3.0%
]
2.58%
32,25820.2%
[
2.5%
-
3.0%
]
2.67%
80,5933.7%
[
2.5%
-
3.0%
]
2.78%
49,48317.8%
[
2.5%
-
3.0%
]
2.86%
1,2243.2%
[
3.0%
-
3.5%
]
3.03%
71,81212.0%
[
3.0%
-
3.5%
]
3.09%
79,85521.6%
[
3.5%
-
4.0%
]
3.53%
10,7563.6%
[
3.5%
-
4.0%
]
3.83%
54,77912.4%
[
4.0%
-
4.5%
]
4.09%
59,17710.7%
[
4.5%
-
5.0%
]
4.69%
30,4503.6%
[
5.0%
-
5.5%
]
5.13%
99,80010.1%
[
8.0%
-
8.5%
]
8.20%
140,99411.1%