Egyptian Disability Age Under 5

COMPARE

Egyptian
Race
Ancestry
AfghanAfricanAlaska NativeAlaskan AthabascanAlbanianAleutAlsatianAmericanApacheArabArapahoArgentineanArmenianAssyrian/Chaldean/SyriacAustralianAustrianBahamianBangladeshiBarbadianBasqueBelgianBelizeanBermudanBhutaneseBlackfeetBolivianBrazilianBritishBritish West IndianBulgarianBurmeseCajunCambodianCanadianCape VerdeanCarpatho RusynCelticCentral AmericanCentral American IndianCherokeeCheyenneChickasawChileanChineseChippewaChoctawColombianColvilleComancheCosta RicanCreeCreekCroatianCrowCubanCypriotCzechCzechoslovakianDanishDelawareDominicanDutchDutch West IndianEastern EuropeanEcuadorianEgyptianEnglishEstonianEthiopianEuropeanFijianFilipinoFinnishFrenchFrench American IndianFrench CanadianGermanGerman RussianGhanaianGreekGuamanian/ChamorroGuatemalanGuyaneseHaitianHmongHonduranHopiHoumaHungarianIcelanderIndian (Asian)IndonesianInupiatIranianIraqiIrishIroquoisIsraeliItalianJamaicanJapaneseJordanianKenyanKiowaKoreanLaotianLatvianLebaneseLiberianLithuanianLumbeeLuxembourgerMacedonianMalaysianMalteseMarshalleseMenomineeMexicanMexican American IndianMongolianMoroccanNative HawaiianNavajoNepaleseNew ZealanderNicaraguanNigerianNorthern EuropeanNorwegianOkinawanOsageOttawaPaiutePakistaniPalestinianPanamanianParaguayanPennsylvania GermanPeruvianPimaPolishPortuguesePotawatomiPuebloPuerto RicanPuget Sound SalishRomanianRussianSalvadoranSamoanScandinavianScotch-IrishScottishSeminoleSenegaleseSerbianShoshoneSierra LeoneanSiouxSlavicSlovakSloveneSomaliSouth AfricanSouth AmericanSouth American IndianSoviet UnionSpaniardSpanishSpanish AmericanSpanish American IndianSri LankanSubsaharan AfricanSudaneseSwedishSwissSyrianTaiwaneseThaiTlingit-HaidaTohono O'OdhamTonganTrinidadian and TobagonianTsimshianTurkishU.S. Virgin IslanderUgandanUkrainianUruguayanUteVenezuelanVietnameseWelshWest IndianYakamaYaquiYugoslavianYumanYup'ikZimbabwean
Immigration
NonimmigrantsImmigrantsAfghanistanAfricaAlbaniaArgentinaArmeniaAsiaAustraliaAustriaBahamasBangladeshBarbadosBelarusBelgiumBelizeBoliviaBosnia and HerzegovinaBrazilBulgariaBurma/MyanmarCabo VerdeCambodiaCameroonCanadaCaribbeanCentral AmericaChileChinaColombiaCongoCosta RicaCroatiaCubaCzechoslovakiaDenmarkDominicaDominican RepublicEastern AfricaEastern AsiaEastern EuropeEcuadorEgyptEl SalvadorEnglandEritreaEthiopiaEuropeFijiFranceGermanyGhanaGreeceGrenadaGuatemalaGuyanaHaitiHondurasHong KongHungaryIndiaIndonesiaIranIraqIrelandIsraelItalyJamaicaJapanJordanKazakhstanKenyaKoreaKuwaitLaosLatin AmericaLatviaLebanonLiberiaLithuaniaMalaysiaMexicoMicronesiaMiddle AfricaMoldovaMoroccoNepalNetherlandsNicaraguaNigeriaNorth AmericaNorth MacedoniaNorthern AfricaNorthern EuropeNorwayOceaniaPakistanPanamaPeruPhilippinesPolandPortugalRomaniaRussiaSaudi ArabiaScotlandSenegalSerbiaSierra LeoneSingaporeSomaliaSouth AfricaSouth AmericaSouth Central AsiaSouth Eastern AsiaSouthern EuropeSpainSri LankaSt. Vincent and the GrenadinesSudanSwedenSwitzerlandSyriaTaiwanThailandTrinidad and TobagoTurkeyUgandaUkraineUruguayUzbekistanVenezuelaVietnamWest IndiesWestern AfricaWestern AsiaWestern EuropeYemenZaireZimbabweAzores
Select to Compare
Race
Ancestry
AfghanAfricanAlaska NativeAlaskan AthabascanAlbanianAleutAlsatianAmericanApacheArabArapahoArgentineanArmenianAssyrian/Chaldean/SyriacAustralianAustrianBahamianBangladeshiBarbadianBasqueBelgianBelizeanBermudanBhutaneseBlackfeetBolivianBrazilianBritishBritish West IndianBulgarianBurmeseCajunCambodianCanadianCape VerdeanCarpatho RusynCelticCentral AmericanCentral American IndianCherokeeCheyenneChickasawChileanChineseChippewaChoctawColombianColvilleComancheCosta RicanCreeCreekCroatianCrowCubanCypriotCzechCzechoslovakianDanishDelawareDominicanDutchDutch West IndianEastern EuropeanEcuadorianEnglishEstonianEthiopianEuropeanFijianFilipinoFinnishFrenchFrench American IndianFrench CanadianGermanGerman RussianGhanaianGreekGuamanian/ChamorroGuatemalanGuyaneseHaitianHmongHonduranHopiHoumaHungarianIcelanderIndian (Asian)IndonesianInupiatIranianIraqiIrishIroquoisIsraeliItalianJamaicanJapaneseJordanianKenyanKiowaKoreanLaotianLatvianLebaneseLiberianLithuanianLumbeeLuxembourgerMacedonianMalaysianMalteseMarshalleseMenomineeMexicanMexican American IndianMongolianMoroccanNative HawaiianNavajoNepaleseNew ZealanderNicaraguanNigerianNorthern EuropeanNorwegianOkinawanOsageOttawaPaiutePakistaniPalestinianPanamanianParaguayanPennsylvania GermanPeruvianPimaPolishPortuguesePotawatomiPuebloPuerto RicanPuget Sound SalishRomanianRussianSalvadoranSamoanScandinavianScotch-IrishScottishSeminoleSenegaleseSerbianShoshoneSierra LeoneanSiouxSlavicSlovakSloveneSomaliSouth AfricanSouth AmericanSouth American IndianSoviet UnionSpaniardSpanishSpanish AmericanSpanish American IndianSri LankanSubsaharan AfricanSudaneseSwedishSwissSyrianTaiwaneseThaiTlingit-HaidaTohono O'OdhamTonganTrinidadian and TobagonianTsimshianTurkishU.S. Virgin IslanderUgandanUkrainianUruguayanUteVenezuelanVietnameseWelshWest IndianYakamaYaquiYugoslavianYumanYup'ikZimbabwean
Immigration
NonimmigrantsImmigrantsAfghanistanAfricaAlbaniaArgentinaArmeniaAsiaAustraliaAustriaBahamasBangladeshBarbadosBelarusBelgiumBelizeBoliviaBosnia and HerzegovinaBrazilBulgariaBurma/MyanmarCabo VerdeCambodiaCameroonCanadaCaribbeanCentral AmericaChileChinaColombiaCongoCosta RicaCroatiaCubaCzechoslovakiaDenmarkDominicaDominican RepublicEastern AfricaEastern AsiaEastern EuropeEcuadorEgyptEl SalvadorEnglandEritreaEthiopiaEuropeFijiFranceGermanyGhanaGreeceGrenadaGuatemalaGuyanaHaitiHondurasHong KongHungaryIndiaIndonesiaIranIraqIrelandIsraelItalyJamaicaJapanJordanKazakhstanKenyaKoreaKuwaitLaosLatin AmericaLatviaLebanonLiberiaLithuaniaMalaysiaMexicoMicronesiaMiddle AfricaMoldovaMoroccoNepalNetherlandsNicaraguaNigeriaNorth AmericaNorth MacedoniaNorthern AfricaNorthern EuropeNorwayOceaniaPakistanPanamaPeruPhilippinesPolandPortugalRomaniaRussiaSaudi ArabiaScotlandSenegalSerbiaSierra LeoneSingaporeSomaliaSouth AfricaSouth AmericaSouth Central AsiaSouth Eastern AsiaSouthern EuropeSpainSri LankaSt. Vincent and the GrenadinesSudanSwedenSwitzerlandSyriaTaiwanThailandTrinidad and TobagoTurkeyUgandaUkraineUruguayUzbekistanVenezuelaVietnamWest IndiesWestern AfricaWestern AsiaWestern EuropeYemenZaireZimbabweAzores
Disability Age Under 5
Income
Poverty
Unemployment
Labor Participation
Family Structure
Vehicle Availability
Education Level
Disability

Egyptian Disability Age Under 5
Exceptional

1.1%
DISABILITY | AGE UNDER 5
98.9/ 100
METRIC RATING
64th/ 347
METRIC RANK

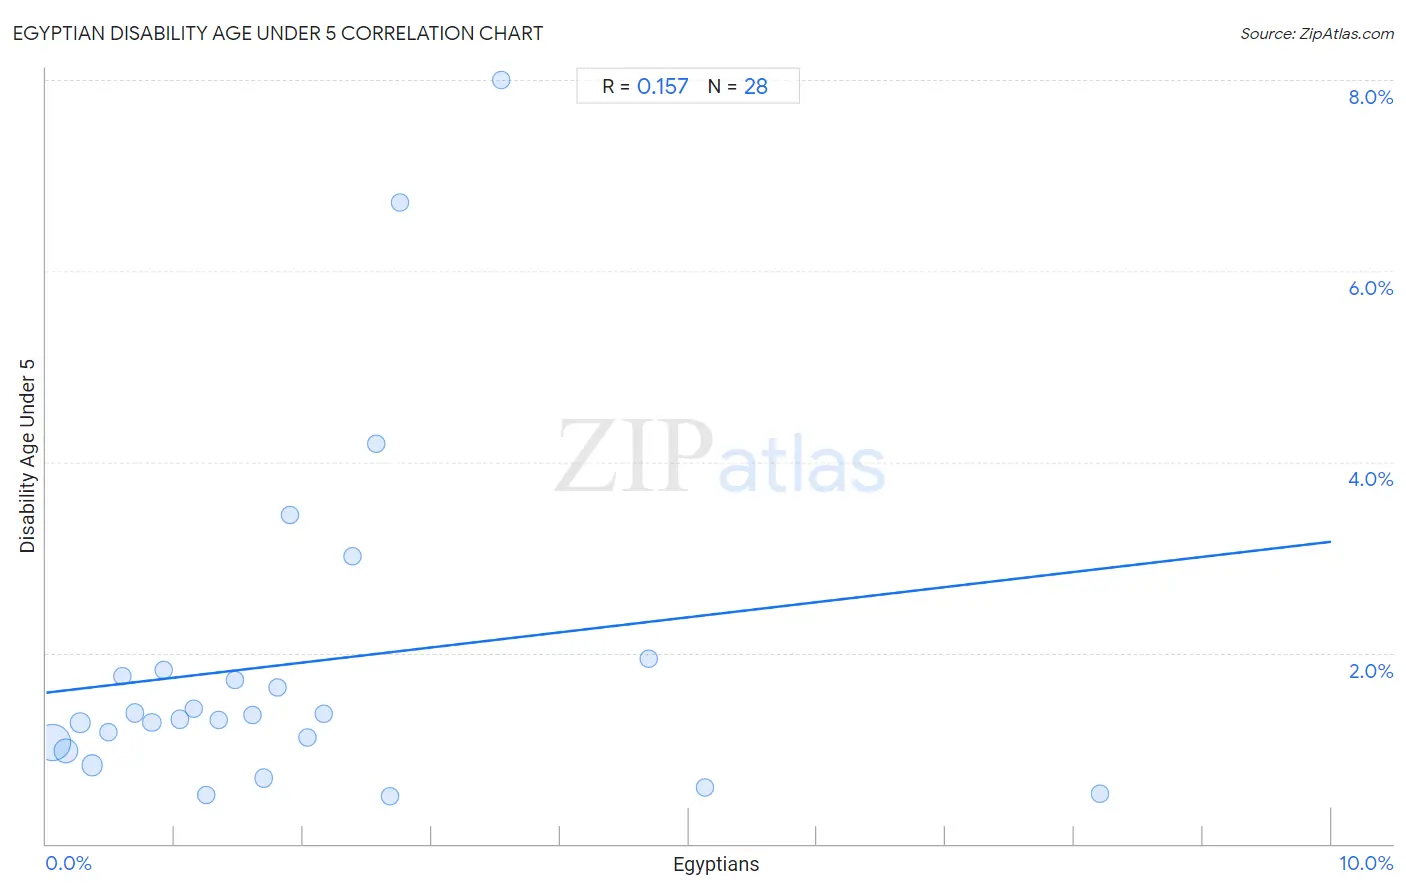
Egyptian Disability Age Under 5 Correlation Chart

The statistical analysis conducted on geographies consisting of 167,621,034 people shows a poor positive correlation between the proportion of Egyptians and percentage of population with a disability under the age of 5 in the United States with a correlation coefficient (R) of 0.157 and weighted average of 1.1%. On average, for every 1% (one percent) increase in Egyptians within a typical geography, there is an increase of 0.16% in percentage of population with a disability under the age of 5.
Egyptian Disability Age Under 5
It is essential to understand that the correlation between the percentage of Egyptians and percentage of population with a disability under the age of 5 does not imply a direct cause-and-effect relationship. It remains uncertain whether the presence of Egyptians influences an upward or downward trend in the level of percentage of population with a disability under the age of 5 within an area, or if Egyptians simply ended up residing in those areas with higher or lower levels of percentage of population with a disability under the age of 5 due to other factors.

Demographics Similar to Egyptians by Disability Age Under 5

In terms of disability age under 5, the demographic groups most similar to Egyptians are Immigrants from Korea (1.1%, a difference of 0.34%), Immigrants from Vietnam (1.1%, a difference of 0.46%), Immigrants from Indonesia (1.1%, a difference of 0.46%), Immigrants from Belize (1.1%, a difference of 0.53%), and Immigrants from Switzerland (1.1%, a difference of 0.57%).
DemographicsRating | RankDisability Age Under 5
Assyrians/Chaldeans/Syriacs
99.5
/100
|
#57
Exceptional
1.1%
Immigrants from Egypt
99.4
/100
|
#58
Exceptional
1.1%
Immigrants from Malaysia
99.4
/100
|
#59
Exceptional
1.1%
Immigrants from Western Asia
99.2
/100
|
#60
Exceptional
1.1%
Immigrants from Ethiopia
99.2
/100
|
#61
Exceptional
1.1%
Immigrants from Switzerland
99.2
/100
|
#62
Exceptional
1.1%
Immigrants from Vietnam
99.1
/100
|
#63
Exceptional
1.1%
Egyptians
98.9
/100
|
#64
Exceptional
1.1%
Immigrants from Korea
98.8
/100
|
#65
Exceptional
1.1%
Immigrants from Indonesia
98.7
/100
|
#66
Exceptional
1.1%
Immigrants from Belize
98.7
/100
|
#67
Exceptional
1.1%
South Africans
98.7
/100
|
#68
Exceptional
1.1%
Israelis
98.7
/100
|
#69
Exceptional
1.1%
Immigrants from Ecuador
98.6
/100
|
#70
Exceptional
1.1%
Trinidadians and Tobagonians
98.6
/100
|
#71
Exceptional
1.1%

Egyptian Disability Age Under 5 Correlation Summary

MeasurementEgyptian DataDisability Age Under 5 Data
Minimum0.047%0.49%
Maximum8.2%8.0%
Range8.2%7.5%
Mean1.9%1.9%
Median1.5%1.3%
Interquartile 25% (IQ1)0.76%1.0%
Interquartile 75% (IQ3)2.5%1.8%
Interquartile Range (IQR)1.7%0.77%
Standard Deviation (Sample)1.8%1.8%
Standard Deviation (Population)1.7%1.7%

Correlation Details

Egyptian PercentileSample SizeDisability Age Under 5
[
0.0%
-
0.5%
]
0.047%
95,567,0001.1%
[
0.0%
-
0.5%
]
0.15%
35,245,7270.97%
[
0.0%
-
0.5%
]
0.26%
10,291,4471.3%
[
0.0%
-
0.5%
]
0.36%
16,003,0170.82%
[
0.0%
-
0.5%
]
0.49%
3,287,6981.2%
[
0.5%
-
1.0%
]
0.59%
1,207,6031.8%
[
0.5%
-
1.0%
]
0.69%
1,488,5201.4%
[
0.5%
-
1.0%
]
0.82%
654,9811.3%
[
0.5%
-
1.0%
]
0.92%
528,8271.8%
[
1.0%
-
1.5%
]
1.04%
993,0721.3%
[
1.0%
-
1.5%
]
1.15%
252,6691.4%
[
1.0%
-
1.5%
]
1.24%
263,0170.51%
[
1.0%
-
1.5%
]
1.34%
408,8241.3%
[
1.0%
-
1.5%
]
1.47%
95,4561.7%
[
1.5%
-
2.0%
]
1.60%
137,4931.4%
[
1.5%
-
2.0%
]
1.70%
138,3090.69%
[
1.5%
-
2.0%
]
1.80%
183,7411.6%
[
1.5%
-
2.0%
]
1.90%
163,0403.4%
[
2.0%
-
2.5%
]
2.03%
149,9861.1%
[
2.0%
-
2.5%
]
2.16%
121,9301.4%
[
2.0%
-
2.5%
]
2.38%
35,4633.0%
[
2.5%
-
3.0%
]
2.57%
21,8294.2%
[
2.5%
-
3.0%
]
2.67%
80,5930.49%
[
2.5%
-
3.0%
]
2.75%
28,0816.7%
[
3.5%
-
4.0%
]
3.54%
1,4678.0%
[
4.5%
-
5.0%
]
4.69%
30,4501.9%
[
5.0%
-
5.5%
]
5.13%
99,8000.59%
[
8.0%
-
8.5%
]
8.20%
140,9940.53%