Egyptian 2 or more Vehicles in Household
COMPARE
Egyptian
Select to Compare
2 or more Vehicles in Household
Egyptian 2 or more Vehicles in Household
54.3%
2+ VEHICLES AVAILABLE
12.0/ 100
METRIC RATING
208th/ 347
METRIC RANK
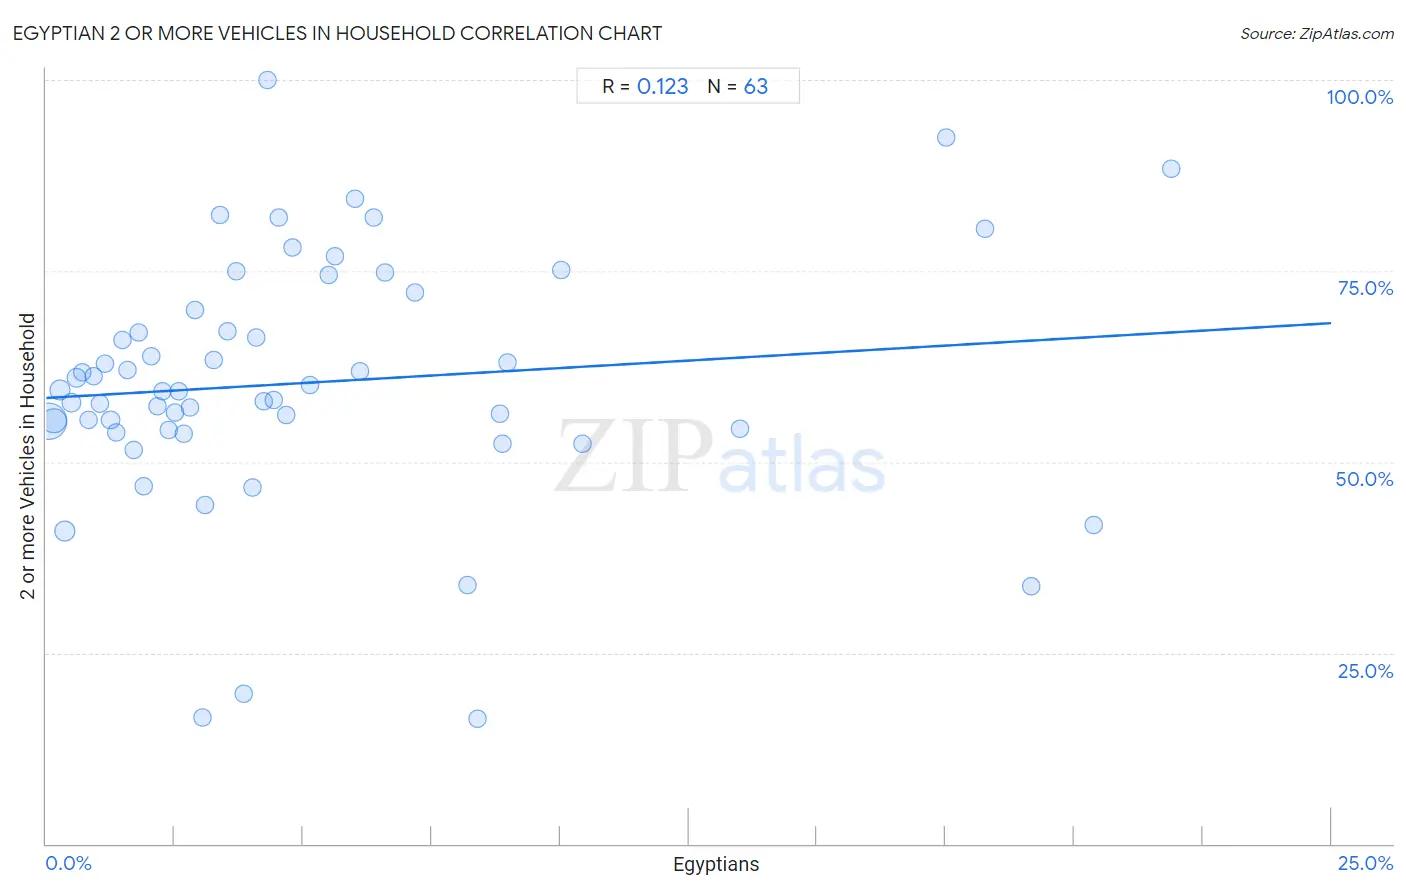
Egyptian 2 or more Vehicles in Household Correlation Chart
The statistical analysis conducted on geographies consisting of 276,797,335 people shows a poor positive correlation between the proportion of Egyptians and percentage of households with 2 or more vehicles available in the United States with a correlation coefficient (R) of 0.123 and weighted average of 54.3%. On average, for every 1% (one percent) increase in Egyptians within a typical geography, there is an increase of 0.39% in percentage of households with 2 or more vehicles available.
It is essential to understand that the correlation between the percentage of Egyptians and percentage of households with 2 or more vehicles available does not imply a direct cause-and-effect relationship. It remains uncertain whether the presence of Egyptians influences an upward or downward trend in the level of percentage of households with 2 or more vehicles available within an area, or if Egyptians simply ended up residing in those areas with higher or lower levels of percentage of households with 2 or more vehicles available due to other factors.
Demographics Similar to Egyptians by 2 or more Vehicles in Household
In terms of 2 or more vehicles in household, the demographic groups most similar to Egyptians are Immigrants from Bulgaria (54.3%, a difference of 0.0%), Immigrants from Saudi Arabia (54.2%, a difference of 0.060%), Immigrants from Hungary (54.2%, a difference of 0.070%), Turkish (54.3%, a difference of 0.090%), and Immigrants from Chile (54.2%, a difference of 0.090%).
| Demographics | Rating | Rank | 2 or more Vehicles in Household |
| Immigrants from Italy | 15.5 /100 | #201 | Poor 54.4% |
| Immigrants from North Macedonia | 14.9 /100 | #202 | Poor 54.4% |
| Immigrants from Peru | 14.3 /100 | #203 | Poor 54.4% |
| Immigrants from Belgium | 13.7 /100 | #204 | Poor 54.3% |
| Cheyenne | 13.6 /100 | #205 | Poor 54.3% |
| Immigrants from Latin America | 13.1 /100 | #206 | Poor 54.3% |
| Turks | 13.0 /100 | #207 | Poor 54.3% |
| Egyptians | 12.0 /100 | #208 | Poor 54.3% |
| Immigrants from Bulgaria | 12.0 /100 | #209 | Poor 54.3% |
| Immigrants from Saudi Arabia | 11.3 /100 | #210 | Poor 54.2% |
| Immigrants from Hungary | 11.3 /100 | #211 | Poor 54.2% |
| Immigrants from Chile | 11.1 /100 | #212 | Poor 54.2% |
| Guatemalans | 9.6 /100 | #213 | Tragic 54.1% |
| Immigrants from Czechoslovakia | 9.4 /100 | #214 | Tragic 54.1% |
| Aleuts | 9.3 /100 | #215 | Tragic 54.1% |
Egyptian 2 or more Vehicles in Household Correlation Summary
| Measurement | Egyptian Data | 2 or more Vehicles in Household Data |
| Minimum | 0.048% | 16.3% |
| Maximum | 21.9% | 100.0% |
| Range | 21.8% | 83.7% |
| Mean | 5.1% | 60.4% |
| Median | 3.5% | 59.3% |
| Interquartile 25% (IQ1) | 1.7% | 54.2% |
| Interquartile 75% (IQ3) | 6.4% | 69.9% |
| Interquartile Range (IQR) | 4.7% | 15.6% |
| Standard Deviation (Sample) | 5.1% | 16.3% |
| Standard Deviation (Population) | 5.1% | 16.2% |
Correlation Details
| Egyptian Percentile | Sample Size | 2 or more Vehicles in Household |
[ 0.0% - 0.5% ] 0.048% | 148,552,991 | 55.3% |
[ 0.0% - 0.5% ] 0.16% | 57,315,583 | 55.4% |
[ 0.0% - 0.5% ] 0.27% | 20,122,206 | 59.4% |
[ 0.0% - 0.5% ] 0.36% | 22,779,786 | 40.9% |
[ 0.0% - 0.5% ] 0.49% | 7,447,302 | 57.7% |
[ 0.5% - 1.0% ] 0.60% | 4,831,139 | 61.0% |
[ 0.5% - 1.0% ] 0.70% | 3,225,676 | 61.7% |
[ 0.5% - 1.0% ] 0.82% | 2,417,282 | 55.5% |
[ 0.5% - 1.0% ] 0.93% | 1,797,091 | 61.2% |
[ 1.0% - 1.5% ] 1.04% | 1,983,146 | 57.6% |
[ 1.0% - 1.5% ] 1.14% | 855,863 | 62.8% |
[ 1.0% - 1.5% ] 1.25% | 676,576 | 55.4% |
[ 1.0% - 1.5% ] 1.35% | 775,907 | 53.8% |
[ 1.0% - 1.5% ] 1.48% | 391,296 | 66.0% |
[ 1.5% - 2.0% ] 1.59% | 416,568 | 62.0% |
[ 1.5% - 2.0% ] 1.69% | 513,256 | 51.6% |
[ 1.5% - 2.0% ] 1.80% | 290,694 | 66.9% |
[ 1.5% - 2.0% ] 1.89% | 742,845 | 46.7% |
[ 2.0% - 2.5% ] 2.04% | 262,183 | 63.9% |
[ 2.0% - 2.5% ] 2.16% | 122,258 | 57.2% |
[ 2.0% - 2.5% ] 2.27% | 28,023 | 59.3% |
[ 2.0% - 2.5% ] 2.37% | 77,570 | 54.2% |
[ 2.5% - 3.0% ] 2.51% | 9,255 | 56.4% |
[ 2.5% - 3.0% ] 2.58% | 159,607 | 59.3% |
[ 2.5% - 3.0% ] 2.66% | 145,756 | 53.6% |
[ 2.5% - 3.0% ] 2.79% | 96,434 | 57.1% |
[ 2.5% - 3.0% ] 2.90% | 3,965 | 69.9% |
[ 3.0% - 3.5% ] 3.03% | 77,913 | 16.5% |
[ 3.0% - 3.5% ] 3.10% | 113,794 | 44.4% |
[ 3.0% - 3.5% ] 3.25% | 9,596 | 63.4% |
[ 3.0% - 3.5% ] 3.38% | 5,444 | 82.3% |
[ 3.5% - 4.0% ] 3.53% | 18,086 | 67.1% |
[ 3.5% - 4.0% ] 3.70% | 81 | 75.0% |
[ 3.5% - 4.0% ] 3.83% | 58,053 | 19.7% |
[ 4.0% - 4.5% ] 4.01% | 5,835 | 46.6% |
[ 4.0% - 4.5% ] 4.09% | 60,303 | 66.3% |
[ 4.0% - 4.5% ] 4.22% | 13,070 | 57.9% |
[ 4.0% - 4.5% ] 4.32% | 533 | 100.0% |
[ 4.0% - 4.5% ] 4.44% | 36,823 | 58.1% |
[ 4.5% - 5.0% ] 4.52% | 155 | 82.0% |
[ 4.5% - 5.0% ] 4.67% | 52,230 | 56.1% |
[ 4.5% - 5.0% ] 4.79% | 4,782 | 78.1% |
[ 5.0% - 5.5% ] 5.13% | 99,800 | 60.1% |
[ 5.0% - 5.5% ] 5.49% | 601 | 74.4% |
[ 5.5% - 6.0% ] 5.61% | 659 | 76.9% |
[ 5.5% - 6.0% ] 5.99% | 3,553 | 84.4% |
[ 6.0% - 6.5% ] 6.10% | 6,952 | 61.9% |
[ 6.0% - 6.5% ] 6.36% | 14,518 | 82.0% |
[ 6.5% - 7.0% ] 6.59% | 8,410 | 74.9% |
[ 7.0% - 7.5% ] 7.17% | 7,017 | 72.1% |
[ 8.0% - 8.5% ] 8.20% | 140,994 | 33.9% |
[ 8.0% - 8.5% ] 8.40% | 750 | 16.3% |
[ 8.5% - 9.0% ] 8.83% | 1,155 | 56.2% |
[ 8.5% - 9.0% ] 8.89% | 1,429 | 52.4% |
[ 8.5% - 9.0% ] 8.97% | 747 | 63.1% |
[ 10.0% - 10.5% ] 10.02% | 5,751 | 75.2% |
[ 10.0% - 10.5% ] 10.44% | 5,000 | 52.4% |
[ 13.0% - 13.5% ] 13.49% | 1,394 | 54.3% |
[ 17.0% - 17.5% ] 17.50% | 120 | 92.5% |
[ 18.0% - 18.5% ] 18.26% | 241 | 80.5% |
[ 19.0% - 19.5% ] 19.16% | 981 | 33.8% |
[ 20.0% - 20.5% ] 20.38% | 211 | 41.7% |
[ 21.5% - 22.0% ] 21.88% | 96 | 88.5% |