Egyptian Married-Couple Family Poverty

COMPARE

Egyptian
Race
Ancestry
AfghanAfricanAlaska NativeAlaskan AthabascanAlbanianAleutAlsatianAmericanApacheArabArapahoArgentineanArmenianAssyrian/Chaldean/SyriacAustralianAustrianBahamianBangladeshiBarbadianBasqueBelgianBelizeanBermudanBhutaneseBlackfeetBolivianBrazilianBritishBritish West IndianBulgarianBurmeseCajunCambodianCanadianCape VerdeanCarpatho RusynCelticCentral AmericanCentral American IndianCherokeeCheyenneChickasawChileanChineseChippewaChoctawColombianColvilleComancheCosta RicanCreeCreekCroatianCrowCubanCypriotCzechCzechoslovakianDanishDelawareDominicanDutchDutch West IndianEastern EuropeanEcuadorianEgyptianEnglishEstonianEthiopianEuropeanFijianFilipinoFinnishFrenchFrench American IndianFrench CanadianGermanGerman RussianGhanaianGreekGuamanian/ChamorroGuatemalanGuyaneseHaitianHmongHonduranHopiHoumaHungarianIcelanderIndian (Asian)IndonesianInupiatIranianIraqiIrishIroquoisIsraeliItalianJamaicanJapaneseJordanianKenyanKiowaKoreanLaotianLatvianLebaneseLiberianLithuanianLumbeeLuxembourgerMacedonianMalaysianMalteseMarshalleseMenomineeMexicanMexican American IndianMongolianMoroccanNative HawaiianNavajoNepaleseNew ZealanderNicaraguanNigerianNorthern EuropeanNorwegianOkinawanOsageOttawaPaiutePakistaniPalestinianPanamanianParaguayanPennsylvania GermanPeruvianPimaPolishPortuguesePotawatomiPuebloPuerto RicanPuget Sound SalishRomanianRussianSalvadoranSamoanScandinavianScotch-IrishScottishSeminoleSenegaleseSerbianShoshoneSierra LeoneanSiouxSlavicSlovakSloveneSomaliSouth AfricanSouth AmericanSouth American IndianSoviet UnionSpaniardSpanishSpanish AmericanSpanish American IndianSri LankanSubsaharan AfricanSudaneseSwedishSwissSyrianTaiwaneseThaiTlingit-HaidaTohono O'OdhamTonganTrinidadian and TobagonianTsimshianTurkishU.S. Virgin IslanderUgandanUkrainianUruguayanUteVenezuelanVietnameseWelshWest IndianYakamaYaquiYugoslavianYumanYup'ikZimbabwean
Immigration
NonimmigrantsImmigrantsAfghanistanAfricaAlbaniaArgentinaArmeniaAsiaAustraliaAustriaBahamasBangladeshBarbadosBelarusBelgiumBelizeBoliviaBosnia and HerzegovinaBrazilBulgariaBurma/MyanmarCabo VerdeCambodiaCameroonCanadaCaribbeanCentral AmericaChileChinaColombiaCongoCosta RicaCroatiaCubaCzechoslovakiaDenmarkDominicaDominican RepublicEastern AfricaEastern AsiaEastern EuropeEcuadorEgyptEl SalvadorEnglandEritreaEthiopiaEuropeFijiFranceGermanyGhanaGreeceGrenadaGuatemalaGuyanaHaitiHondurasHong KongHungaryIndiaIndonesiaIranIraqIrelandIsraelItalyJamaicaJapanJordanKazakhstanKenyaKoreaKuwaitLaosLatin AmericaLatviaLebanonLiberiaLithuaniaMalaysiaMexicoMicronesiaMiddle AfricaMoldovaMoroccoNepalNetherlandsNicaraguaNigeriaNorth AmericaNorth MacedoniaNorthern AfricaNorthern EuropeNorwayOceaniaPakistanPanamaPeruPhilippinesPolandPortugalRomaniaRussiaSaudi ArabiaScotlandSenegalSerbiaSierra LeoneSingaporeSomaliaSouth AfricaSouth AmericaSouth Central AsiaSouth Eastern AsiaSouthern EuropeSpainSri LankaSt. Vincent and the GrenadinesSudanSwedenSwitzerlandSyriaTaiwanThailandTrinidad and TobagoTurkeyUgandaUkraineUruguayUzbekistanVenezuelaVietnamWest IndiesWestern AfricaWestern AsiaWestern EuropeYemenZaireZimbabweAzores
Select to Compare
Race
Ancestry
AfghanAfricanAlaska NativeAlaskan AthabascanAlbanianAleutAlsatianAmericanApacheArabArapahoArgentineanArmenianAssyrian/Chaldean/SyriacAustralianAustrianBahamianBangladeshiBarbadianBasqueBelgianBelizeanBermudanBhutaneseBlackfeetBolivianBrazilianBritishBritish West IndianBulgarianBurmeseCajunCambodianCanadianCape VerdeanCarpatho RusynCelticCentral AmericanCentral American IndianCherokeeCheyenneChickasawChileanChineseChippewaChoctawColombianColvilleComancheCosta RicanCreeCreekCroatianCrowCubanCypriotCzechCzechoslovakianDanishDelawareDominicanDutchDutch West IndianEastern EuropeanEcuadorianEnglishEstonianEthiopianEuropeanFijianFilipinoFinnishFrenchFrench American IndianFrench CanadianGermanGerman RussianGhanaianGreekGuamanian/ChamorroGuatemalanGuyaneseHaitianHmongHonduranHopiHoumaHungarianIcelanderIndian (Asian)IndonesianInupiatIranianIraqiIrishIroquoisIsraeliItalianJamaicanJapaneseJordanianKenyanKiowaKoreanLaotianLatvianLebaneseLiberianLithuanianLumbeeLuxembourgerMacedonianMalaysianMalteseMarshalleseMenomineeMexicanMexican American IndianMongolianMoroccanNative HawaiianNavajoNepaleseNew ZealanderNicaraguanNigerianNorthern EuropeanNorwegianOkinawanOsageOttawaPaiutePakistaniPalestinianPanamanianParaguayanPennsylvania GermanPeruvianPimaPolishPortuguesePotawatomiPuebloPuerto RicanPuget Sound SalishRomanianRussianSalvadoranSamoanScandinavianScotch-IrishScottishSeminoleSenegaleseSerbianShoshoneSierra LeoneanSiouxSlavicSlovakSloveneSomaliSouth AfricanSouth AmericanSouth American IndianSoviet UnionSpaniardSpanishSpanish AmericanSpanish American IndianSri LankanSubsaharan AfricanSudaneseSwedishSwissSyrianTaiwaneseThaiTlingit-HaidaTohono O'OdhamTonganTrinidadian and TobagonianTsimshianTurkishU.S. Virgin IslanderUgandanUkrainianUruguayanUteVenezuelanVietnameseWelshWest IndianYakamaYaquiYugoslavianYumanYup'ikZimbabwean
Immigration
NonimmigrantsImmigrantsAfghanistanAfricaAlbaniaArgentinaArmeniaAsiaAustraliaAustriaBahamasBangladeshBarbadosBelarusBelgiumBelizeBoliviaBosnia and HerzegovinaBrazilBulgariaBurma/MyanmarCabo VerdeCambodiaCameroonCanadaCaribbeanCentral AmericaChileChinaColombiaCongoCosta RicaCroatiaCubaCzechoslovakiaDenmarkDominicaDominican RepublicEastern AfricaEastern AsiaEastern EuropeEcuadorEgyptEl SalvadorEnglandEritreaEthiopiaEuropeFijiFranceGermanyGhanaGreeceGrenadaGuatemalaGuyanaHaitiHondurasHong KongHungaryIndiaIndonesiaIranIraqIrelandIsraelItalyJamaicaJapanJordanKazakhstanKenyaKoreaKuwaitLaosLatin AmericaLatviaLebanonLiberiaLithuaniaMalaysiaMexicoMicronesiaMiddle AfricaMoldovaMoroccoNepalNetherlandsNicaraguaNigeriaNorth AmericaNorth MacedoniaNorthern AfricaNorthern EuropeNorwayOceaniaPakistanPanamaPeruPhilippinesPolandPortugalRomaniaRussiaSaudi ArabiaScotlandSenegalSerbiaSierra LeoneSingaporeSomaliaSouth AfricaSouth AmericaSouth Central AsiaSouth Eastern AsiaSouthern EuropeSpainSri LankaSt. Vincent and the GrenadinesSudanSwedenSwitzerlandSyriaTaiwanThailandTrinidad and TobagoTurkeyUgandaUkraineUruguayUzbekistanVenezuelaVietnamWest IndiesWestern AfricaWestern AsiaWestern EuropeYemenZaireZimbabweAzores
Married-Couple Family Poverty
Income
Poverty
Unemployment
Labor Participation
Family Structure
Vehicle Availability
Education Level
Disability

Egyptian Married-Couple Family Poverty
Exceptional

4.8%
POVERTY | MARRIED-COUPLE FAMILIES
92.0/ 100
METRIC RATING
127th/ 347
METRIC RANK

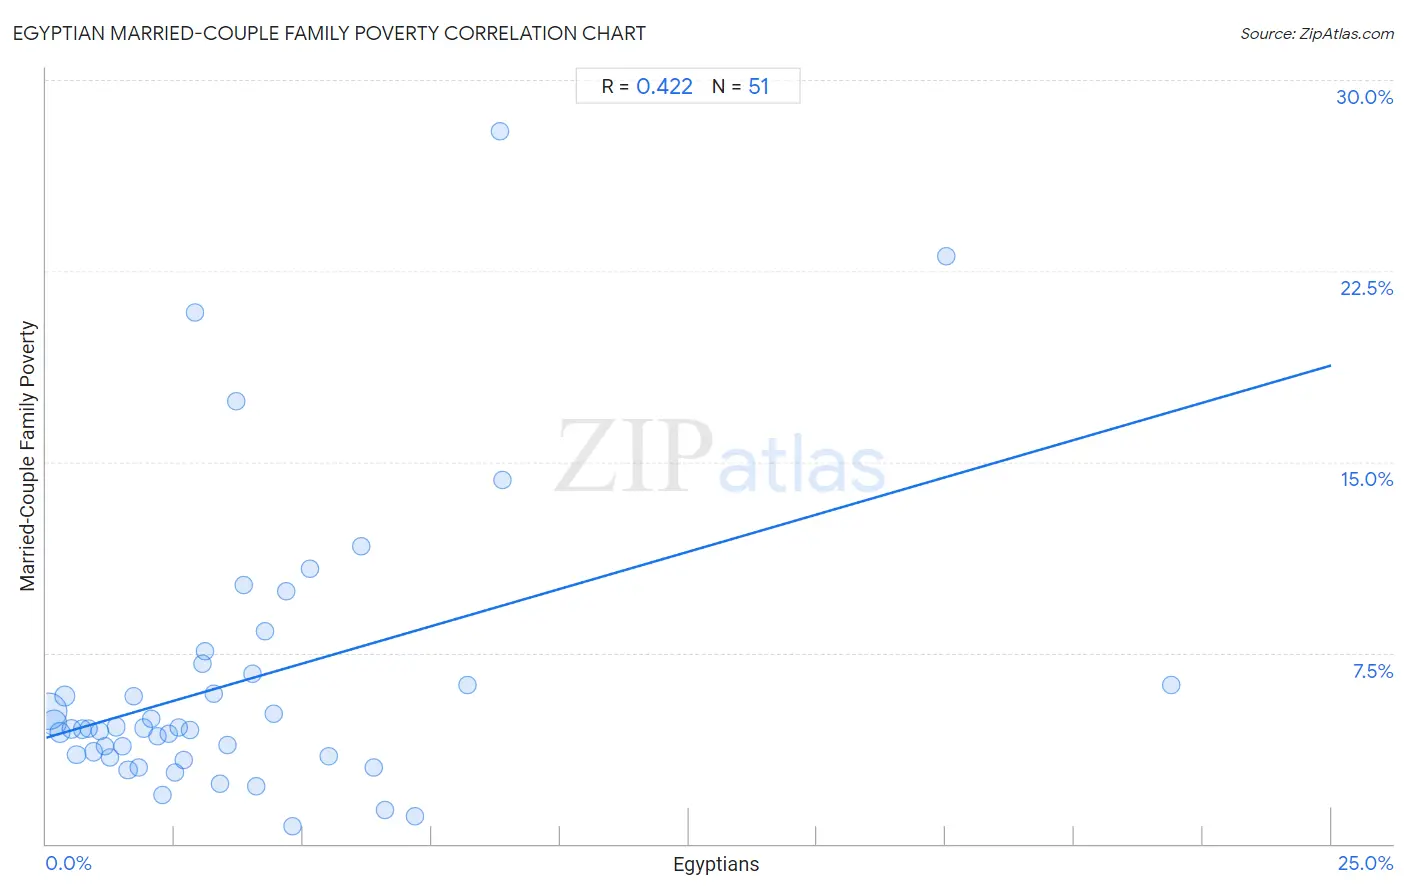
Egyptian Married-Couple Family Poverty Correlation Chart

The statistical analysis conducted on geographies consisting of 275,471,686 people shows a moderate positive correlation between the proportion of Egyptians and poverty level among married-couple families in the United States with a correlation coefficient (R) of 0.422 and weighted average of 4.8%. On average, for every 1% (one percent) increase in Egyptians within a typical geography, there is an increase of 0.58% in poverty level among married-couple families.
Egyptian Married-Couple Family Poverty
It is essential to understand that the correlation between the percentage of Egyptians and poverty level among married-couple families does not imply a direct cause-and-effect relationship. It remains uncertain whether the presence of Egyptians influences an upward or downward trend in the level of poverty level among married-couple families within an area, or if Egyptians simply ended up residing in those areas with higher or lower levels of poverty level among married-couple families due to other factors.

Demographics Similar to Egyptians by Married-Couple Family Poverty

In terms of married-couple family poverty, the demographic groups most similar to Egyptians are Immigrants from Asia (4.8%, a difference of 0.14%), Immigrants from Bosnia and Herzegovina (4.8%, a difference of 0.21%), Romanian (4.8%, a difference of 0.23%), Palestinian (4.9%, a difference of 0.32%), and Jordanian (4.8%, a difference of 0.50%).
DemographicsRating | RankMarried-Couple Family Poverty
Immigrants from Southern Europe
93.4
/100
|
#120
Exceptional
4.8%
Indians (Asian)
93.2
/100
|
#121
Exceptional
4.8%
Whites/Caucasians
93.1
/100
|
#122
Exceptional
4.8%
Jordanians
93.1
/100
|
#123
Exceptional
4.8%
Romanians
92.5
/100
|
#124
Exceptional
4.8%
Immigrants from Bosnia and Herzegovina
92.5
/100
|
#125
Exceptional
4.8%
Immigrants from Asia
92.3
/100
|
#126
Exceptional
4.8%
Egyptians
92.0
/100
|
#127
Exceptional
4.8%
Palestinians
91.2
/100
|
#128
Exceptional
4.9%
Immigrants from Pakistan
90.7
/100
|
#129
Exceptional
4.9%
Soviet Union
90.7
/100
|
#130
Exceptional
4.9%
Immigrants from Eastern Europe
90.5
/100
|
#131
Exceptional
4.9%
Puget Sound Salish
90.4
/100
|
#132
Exceptional
4.9%
Immigrants from Kenya
90.2
/100
|
#133
Exceptional
4.9%
Samoans
90.2
/100
|
#134
Exceptional
4.9%

Egyptian Married-Couple Family Poverty Correlation Summary

MeasurementEgyptian DataMarried-Couple Family Poverty Data
Minimum0.048%0.67%
Maximum21.9%28.0%
Range21.8%27.3%
Mean3.8%6.4%
Median2.8%4.5%
Interquartile 25% (IQ1)1.4%3.4%
Interquartile 75% (IQ3)4.7%6.7%
Interquartile Range (IQR)3.3%3.2%
Standard Deviation (Sample)4.0%5.5%
Standard Deviation (Population)3.9%5.5%

Correlation Details

Egyptian PercentileSample SizeMarried-Couple Family Poverty
[
0.0%
-
0.5%
]
0.048%
148,353,2025.2%
[
0.0%
-
0.5%
]
0.16%
57,100,1404.8%
[
0.0%
-
0.5%
]
0.27%
19,925,0344.4%
[
0.0%
-
0.5%
]
0.36%
22,606,9095.8%
[
0.0%
-
0.5%
]
0.49%
7,385,1994.5%
[
0.5%
-
1.0%
]
0.60%
4,712,8573.5%
[
0.5%
-
1.0%
]
0.70%
3,176,4454.5%
[
0.5%
-
1.0%
]
0.82%
2,358,7514.5%
[
0.5%
-
1.0%
]
0.93%
1,774,0053.6%
[
1.0%
-
1.5%
]
1.04%
1,966,9024.4%
[
1.0%
-
1.5%
]
1.14%
836,8063.8%
[
1.0%
-
1.5%
]
1.25%
655,0073.4%
[
1.0%
-
1.5%
]
1.35%
758,4824.6%
[
1.0%
-
1.5%
]
1.48%
362,3923.8%
[
1.5%
-
2.0%
]
1.59%
394,9442.9%
[
1.5%
-
2.0%
]
1.69%
513,2565.8%
[
1.5%
-
2.0%
]
1.80%
290,4193.0%
[
1.5%
-
2.0%
]
1.89%
727,6434.5%
[
2.0%
-
2.5%
]
2.04%
253,2784.9%
[
2.0%
-
2.5%
]
2.16%
122,1144.2%
[
2.0%
-
2.5%
]
2.27%
25,4741.9%
[
2.0%
-
2.5%
]
2.38%
66,2664.3%
[
2.5%
-
3.0%
]
2.51%
9,2552.8%
[
2.5%
-
3.0%
]
2.58%
158,8794.6%
[
2.5%
-
3.0%
]
2.67%
139,5703.3%
[
2.5%
-
3.0%
]
2.79%
84,9324.5%
[
2.5%
-
3.0%
]
2.89%
2,38520.8%
[
3.0%
-
3.5%
]
3.03%
76,7287.1%
[
3.0%
-
3.5%
]
3.10%
113,5697.6%
[
3.0%
-
3.5%
]
3.25%
9,5965.9%
[
3.0%
-
3.5%
]
3.38%
5,4442.4%
[
3.5%
-
4.0%
]
3.53%
16,6193.9%
[
3.5%
-
4.0%
]
3.70%
8117.4%
[
3.5%
-
4.0%
]
3.83%
55,84710.2%
[
4.0%
-
4.5%
]
4.01%
2996.7%
[
4.0%
-
4.5%
]
4.09%
60,3032.3%
[
4.0%
-
4.5%
]
4.25%
8,2918.3%
[
4.0%
-
4.5%
]
4.43%
34,2285.1%
[
4.5%
-
5.0%
]
4.67%
49,4159.9%
[
4.5%
-
5.0%
]
4.79%
4,7820.67%
[
5.0%
-
5.5%
]
5.13%
99,80010.8%
[
5.0%
-
5.5%
]
5.49%
6013.4%
[
6.0%
-
6.5%
]
6.12%
1,79811.7%
[
6.0%
-
6.5%
]
6.36%
14,5183.0%
[
6.5%
-
7.0%
]
6.59%
8,4101.3%
[
7.0%
-
7.5%
]
7.17%
7,0171.1%
[
8.0%
-
8.5%
]
8.20%
140,9946.3%
[
8.5%
-
9.0%
]
8.83%
1,15528.0%
[
8.5%
-
9.0%
]
8.89%
1,42914.3%
[
17.0%
-
17.5%
]
17.50%
12023.1%
[
21.5%
-
22.0%
]
21.88%
966.2%