Dutch West Indian Single Mother Households

COMPARE

Dutch West Indian
Race
Ancestry
AfghanAfricanAlaska NativeAlaskan AthabascanAlbanianAleutAlsatianAmericanApacheArabArapahoArgentineanArmenianAssyrian/Chaldean/SyriacAustralianAustrianBahamianBangladeshiBarbadianBasqueBelgianBelizeanBermudanBhutaneseBlackfeetBolivianBrazilianBritishBritish West IndianBulgarianBurmeseCajunCambodianCanadianCape VerdeanCarpatho RusynCelticCentral AmericanCentral American IndianCherokeeCheyenneChickasawChileanChineseChippewaChoctawColombianColvilleComancheCosta RicanCreeCreekCroatianCrowCubanCypriotCzechCzechoslovakianDanishDelawareDominicanDutchDutch West IndianEastern EuropeanEcuadorianEgyptianEnglishEstonianEthiopianEuropeanFijianFilipinoFinnishFrenchFrench American IndianFrench CanadianGermanGerman RussianGhanaianGreekGuamanian/ChamorroGuatemalanGuyaneseHaitianHmongHonduranHopiHoumaHungarianIcelanderIndian (Asian)IndonesianInupiatIranianIraqiIrishIroquoisIsraeliItalianJamaicanJapaneseJordanianKenyanKiowaKoreanLaotianLatvianLebaneseLiberianLithuanianLumbeeLuxembourgerMacedonianMalaysianMalteseMarshalleseMenomineeMexicanMexican American IndianMongolianMoroccanNative HawaiianNavajoNepaleseNew ZealanderNicaraguanNigerianNorthern EuropeanNorwegianOkinawanOsageOttawaPaiutePakistaniPalestinianPanamanianParaguayanPennsylvania GermanPeruvianPimaPolishPortuguesePotawatomiPuebloPuerto RicanPuget Sound SalishRomanianRussianSalvadoranSamoanScandinavianScotch-IrishScottishSeminoleSenegaleseSerbianShoshoneSierra LeoneanSiouxSlavicSlovakSloveneSomaliSouth AfricanSouth AmericanSouth American IndianSoviet UnionSpaniardSpanishSpanish AmericanSpanish American IndianSri LankanSubsaharan AfricanSudaneseSwedishSwissSyrianTaiwaneseThaiTlingit-HaidaTohono O'OdhamTonganTrinidadian and TobagonianTsimshianTurkishU.S. Virgin IslanderUgandanUkrainianUruguayanUteVenezuelanVietnameseWelshWest IndianYakamaYaquiYugoslavianYumanYup'ikZimbabwean
Immigration
NonimmigrantsImmigrantsAfghanistanAfricaAlbaniaArgentinaArmeniaAsiaAustraliaAustriaBahamasBangladeshBarbadosBelarusBelgiumBelizeBoliviaBosnia and HerzegovinaBrazilBulgariaBurma/MyanmarCabo VerdeCambodiaCameroonCanadaCaribbeanCentral AmericaChileChinaColombiaCongoCosta RicaCroatiaCubaCzechoslovakiaDenmarkDominicaDominican RepublicEastern AfricaEastern AsiaEastern EuropeEcuadorEgyptEl SalvadorEnglandEritreaEthiopiaEuropeFijiFranceGermanyGhanaGreeceGrenadaGuatemalaGuyanaHaitiHondurasHong KongHungaryIndiaIndonesiaIranIraqIrelandIsraelItalyJamaicaJapanJordanKazakhstanKenyaKoreaKuwaitLaosLatin AmericaLatviaLebanonLiberiaLithuaniaMalaysiaMexicoMicronesiaMiddle AfricaMoldovaMoroccoNepalNetherlandsNicaraguaNigeriaNorth AmericaNorth MacedoniaNorthern AfricaNorthern EuropeNorwayOceaniaPakistanPanamaPeruPhilippinesPolandPortugalRomaniaRussiaSaudi ArabiaScotlandSenegalSerbiaSierra LeoneSingaporeSomaliaSouth AfricaSouth AmericaSouth Central AsiaSouth Eastern AsiaSouthern EuropeSpainSri LankaSt. Vincent and the GrenadinesSudanSwedenSwitzerlandSyriaTaiwanThailandTrinidad and TobagoTurkeyUgandaUkraineUruguayUzbekistanVenezuelaVietnamWest IndiesWestern AfricaWestern AsiaWestern EuropeYemenZaireZimbabweAzores
Select to Compare
Race
Ancestry
AfghanAfricanAlaska NativeAlaskan AthabascanAlbanianAleutAlsatianAmericanApacheArabArapahoArgentineanArmenianAssyrian/Chaldean/SyriacAustralianAustrianBahamianBangladeshiBarbadianBasqueBelgianBelizeanBermudanBhutaneseBlackfeetBolivianBrazilianBritishBritish West IndianBulgarianBurmeseCajunCambodianCanadianCape VerdeanCarpatho RusynCelticCentral AmericanCentral American IndianCherokeeCheyenneChickasawChileanChineseChippewaChoctawColombianColvilleComancheCosta RicanCreeCreekCroatianCrowCubanCypriotCzechCzechoslovakianDanishDelawareDominicanDutchEastern EuropeanEcuadorianEgyptianEnglishEstonianEthiopianEuropeanFijianFilipinoFinnishFrenchFrench American IndianFrench CanadianGermanGerman RussianGhanaianGreekGuamanian/ChamorroGuatemalanGuyaneseHaitianHmongHonduranHopiHoumaHungarianIcelanderIndian (Asian)IndonesianInupiatIranianIraqiIrishIroquoisIsraeliItalianJamaicanJapaneseJordanianKenyanKiowaKoreanLaotianLatvianLebaneseLiberianLithuanianLumbeeLuxembourgerMacedonianMalaysianMalteseMarshalleseMenomineeMexicanMexican American IndianMongolianMoroccanNative HawaiianNavajoNepaleseNew ZealanderNicaraguanNigerianNorthern EuropeanNorwegianOkinawanOsageOttawaPaiutePakistaniPalestinianPanamanianParaguayanPennsylvania GermanPeruvianPimaPolishPortuguesePotawatomiPuebloPuerto RicanPuget Sound SalishRomanianRussianSalvadoranSamoanScandinavianScotch-IrishScottishSeminoleSenegaleseSerbianShoshoneSierra LeoneanSiouxSlavicSlovakSloveneSomaliSouth AfricanSouth AmericanSouth American IndianSoviet UnionSpaniardSpanishSpanish AmericanSpanish American IndianSri LankanSubsaharan AfricanSudaneseSwedishSwissSyrianTaiwaneseThaiTlingit-HaidaTohono O'OdhamTonganTrinidadian and TobagonianTsimshianTurkishU.S. Virgin IslanderUgandanUkrainianUruguayanUteVenezuelanVietnameseWelshWest IndianYakamaYaquiYugoslavianYumanYup'ikZimbabwean
Immigration
NonimmigrantsImmigrantsAfghanistanAfricaAlbaniaArgentinaArmeniaAsiaAustraliaAustriaBahamasBangladeshBarbadosBelarusBelgiumBelizeBoliviaBosnia and HerzegovinaBrazilBulgariaBurma/MyanmarCabo VerdeCambodiaCameroonCanadaCaribbeanCentral AmericaChileChinaColombiaCongoCosta RicaCroatiaCubaCzechoslovakiaDenmarkDominicaDominican RepublicEastern AfricaEastern AsiaEastern EuropeEcuadorEgyptEl SalvadorEnglandEritreaEthiopiaEuropeFijiFranceGermanyGhanaGreeceGrenadaGuatemalaGuyanaHaitiHondurasHong KongHungaryIndiaIndonesiaIranIraqIrelandIsraelItalyJamaicaJapanJordanKazakhstanKenyaKoreaKuwaitLaosLatin AmericaLatviaLebanonLiberiaLithuaniaMalaysiaMexicoMicronesiaMiddle AfricaMoldovaMoroccoNepalNetherlandsNicaraguaNigeriaNorth AmericaNorth MacedoniaNorthern AfricaNorthern EuropeNorwayOceaniaPakistanPanamaPeruPhilippinesPolandPortugalRomaniaRussiaSaudi ArabiaScotlandSenegalSerbiaSierra LeoneSingaporeSomaliaSouth AfricaSouth AmericaSouth Central AsiaSouth Eastern AsiaSouthern EuropeSpainSri LankaSt. Vincent and the GrenadinesSudanSwedenSwitzerlandSyriaTaiwanThailandTrinidad and TobagoTurkeyUgandaUkraineUruguayUzbekistanVenezuelaVietnamWest IndiesWestern AfricaWestern AsiaWestern EuropeYemenZaireZimbabweAzores
Single Mother Households
Income
Poverty
Unemployment
Labor Participation
Family Structure
Vehicle Availability
Education Level
Disability

Dutch West Indian Single Mother Households
Tragic

7.3%
SINGLE MOTHER HOUSEHOLDS
0.4/ 100
METRIC RATING
247th/ 347
METRIC RANK

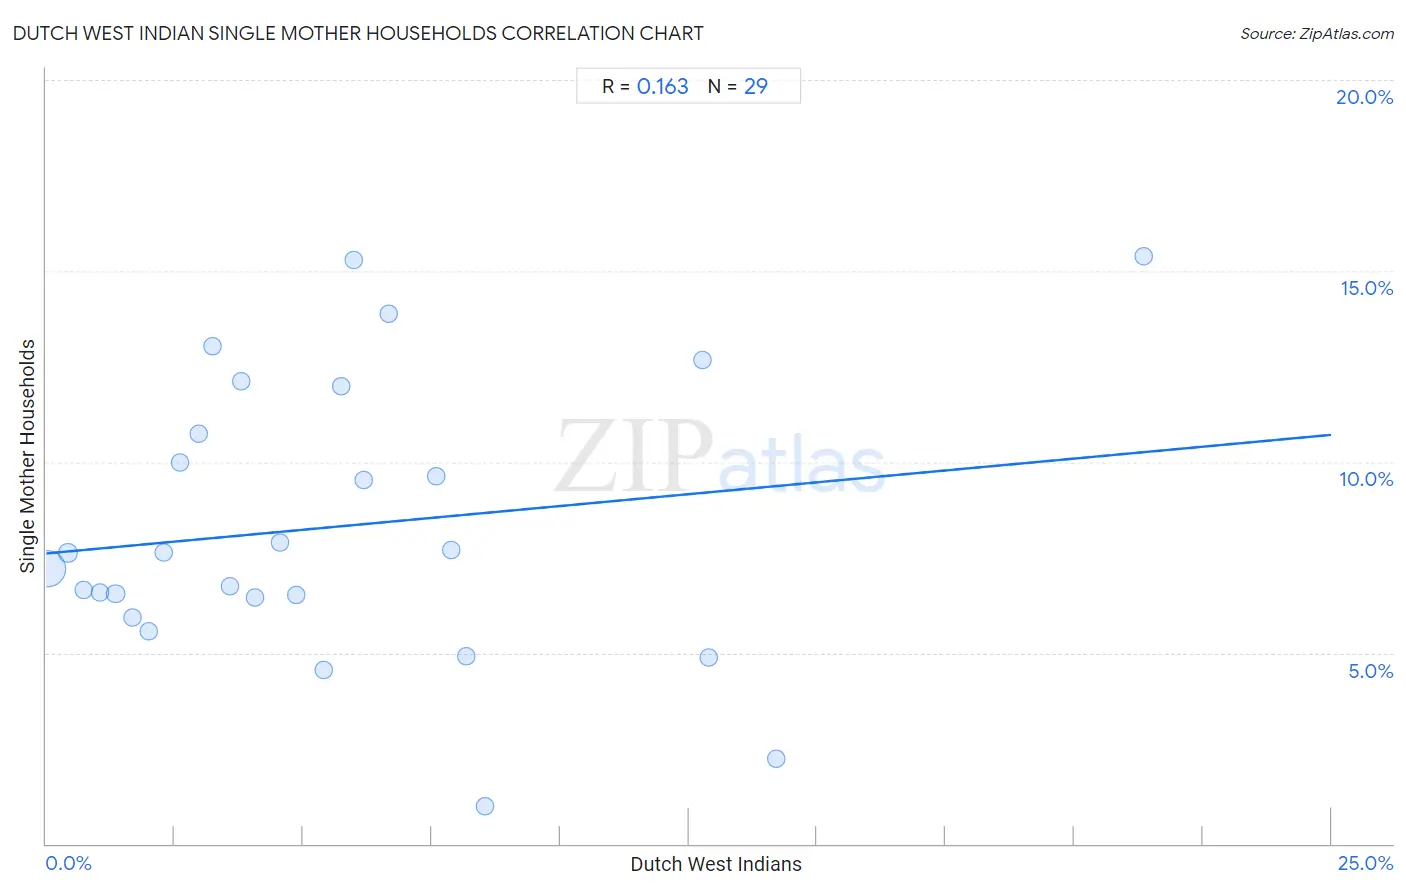
Dutch West Indian Single Mother Households Correlation Chart

The statistical analysis conducted on geographies consisting of 85,708,147 people shows a poor positive correlation between the proportion of Dutch West Indians and percentage of single mother households in the United States with a correlation coefficient (R) of 0.163 and weighted average of 7.3%. On average, for every 1% (one percent) increase in Dutch West Indians within a typical geography, there is an increase of 0.12% in percentage of single mother households.
Dutch West Indian Single Mother Households
It is essential to understand that the correlation between the percentage of Dutch West Indians and percentage of single mother households does not imply a direct cause-and-effect relationship. It remains uncertain whether the presence of Dutch West Indians influences an upward or downward trend in the level of percentage of single mother households within an area, or if Dutch West Indians simply ended up residing in those areas with higher or lower levels of percentage of single mother households due to other factors.

Demographics Similar to Dutch West Indians by Single Mother Households

In terms of single mother households, the demographic groups most similar to Dutch West Indians are Spanish American Indian (7.3%, a difference of 0.030%), Nicaraguan (7.2%, a difference of 0.25%), Bermudan (7.3%, a difference of 0.32%), Immigrants from Africa (7.3%, a difference of 0.33%), and Immigrants from Cambodia (7.2%, a difference of 0.43%).
DemographicsRating | RankSingle Mother Households
Immigrants from Panama
0.7
/100
|
#240
Tragic
7.2%
Immigrants from Portugal
0.6
/100
|
#241
Tragic
7.2%
Fijians
0.6
/100
|
#242
Tragic
7.2%
Ecuadorians
0.6
/100
|
#243
Tragic
7.2%
Cubans
0.6
/100
|
#244
Tragic
7.2%
Immigrants from Cambodia
0.5
/100
|
#245
Tragic
7.2%
Nicaraguans
0.5
/100
|
#246
Tragic
7.2%
Dutch West Indians
0.4
/100
|
#247
Tragic
7.3%
Spanish American Indians
0.4
/100
|
#248
Tragic
7.3%
Bermudans
0.4
/100
|
#249
Tragic
7.3%
Immigrants from Africa
0.4
/100
|
#250
Tragic
7.3%
Malaysians
0.3
/100
|
#251
Tragic
7.3%
Alaskan Athabascans
0.3
/100
|
#252
Tragic
7.3%
Cajuns
0.3
/100
|
#253
Tragic
7.3%
Immigrants from Ecuador
0.3
/100
|
#254
Tragic
7.3%

Dutch West Indian Single Mother Households Correlation Summary

MeasurementDutch West Indian DataSingle Mother Households Data
Minimum0.033%0.97%
Maximum21.3%15.4%
Range21.3%14.4%
Mean5.6%8.3%
Median4.6%7.6%
Interquartile 25% (IQ1)2.1%6.2%
Interquartile 75% (IQ3)7.7%11.3%
Interquartile Range (IQR)5.6%5.2%
Standard Deviation (Sample)4.8%3.6%
Standard Deviation (Population)4.7%3.6%

Correlation Details

Dutch West Indian PercentileSample SizeSingle Mother Households
[
0.0%
-
0.5%
]
0.033%
82,964,3387.2%
[
0.0%
-
0.5%
]
0.42%
1,799,6257.6%
[
0.5%
-
1.0%
]
0.74%
481,4516.6%
[
1.0%
-
1.5%
]
1.05%
179,7016.6%
[
1.0%
-
1.5%
]
1.35%
95,7506.6%
[
1.5%
-
2.0%
]
1.67%
57,0375.9%
[
2.0%
-
2.5%
]
2.00%
43,1535.5%
[
2.0%
-
2.5%
]
2.28%
13,6187.6%
[
2.5%
-
3.0%
]
2.59%
25,21310.0%
[
2.5%
-
3.0%
]
2.95%
12,31910.7%
[
3.0%
-
3.5%
]
3.24%
10,00913.0%
[
3.5%
-
4.0%
]
3.57%
6,2816.7%
[
3.5%
-
4.0%
]
3.80%
2,97212.1%
[
4.0%
-
4.5%
]
4.05%
6,0686.5%
[
4.5%
-
5.0%
]
4.56%
3737.9%
[
4.5%
-
5.0%
]
4.86%
2,6976.5%
[
5.0%
-
5.5%
]
5.41%
4444.5%
[
5.5%
-
6.0%
]
5.75%
1,46212.0%
[
5.5%
-
6.0%
]
5.99%
50115.3%
[
6.0%
-
6.5%
]
6.18%
7289.5%
[
6.5%
-
7.0%
]
6.67%
40513.9%
[
7.5%
-
8.0%
]
7.58%
1,0699.6%
[
7.5%
-
8.0%
]
7.89%
1,4207.7%
[
8.0%
-
8.5%
]
8.17%
2084.9%
[
8.5%
-
9.0%
]
8.54%
3280.97%
[
12.5%
-
13.0%
]
12.76%
43912.7%
[
12.5%
-
13.0%
]
12.88%
1324.9%
[
14.0%
-
14.5%
]
14.20%
3172.2%
[
21.0%
-
21.5%
]
21.35%
8915.4%