Dutch West Indian GED/Equivalency

COMPARE

Dutch West Indian
Race
Ancestry
AfghanAfricanAlaska NativeAlaskan AthabascanAlbanianAleutAlsatianAmericanApacheArabArapahoArgentineanArmenianAssyrian/Chaldean/SyriacAustralianAustrianBahamianBangladeshiBarbadianBasqueBelgianBelizeanBermudanBhutaneseBlackfeetBolivianBrazilianBritishBritish West IndianBulgarianBurmeseCajunCambodianCanadianCape VerdeanCarpatho RusynCelticCentral AmericanCentral American IndianCherokeeCheyenneChickasawChileanChineseChippewaChoctawColombianColvilleComancheCosta RicanCreeCreekCroatianCrowCubanCypriotCzechCzechoslovakianDanishDelawareDominicanDutchDutch West IndianEastern EuropeanEcuadorianEgyptianEnglishEstonianEthiopianEuropeanFijianFilipinoFinnishFrenchFrench American IndianFrench CanadianGermanGerman RussianGhanaianGreekGuamanian/ChamorroGuatemalanGuyaneseHaitianHmongHonduranHopiHoumaHungarianIcelanderIndian (Asian)IndonesianInupiatIranianIraqiIrishIroquoisIsraeliItalianJamaicanJapaneseJordanianKenyanKiowaKoreanLaotianLatvianLebaneseLiberianLithuanianLumbeeLuxembourgerMacedonianMalaysianMalteseMarshalleseMenomineeMexicanMexican American IndianMongolianMoroccanNative HawaiianNavajoNepaleseNew ZealanderNicaraguanNigerianNorthern EuropeanNorwegianOkinawanOsageOttawaPaiutePakistaniPalestinianPanamanianParaguayanPennsylvania GermanPeruvianPimaPolishPortuguesePotawatomiPuebloPuerto RicanPuget Sound SalishRomanianRussianSalvadoranSamoanScandinavianScotch-IrishScottishSeminoleSenegaleseSerbianShoshoneSierra LeoneanSiouxSlavicSlovakSloveneSomaliSouth AfricanSouth AmericanSouth American IndianSoviet UnionSpaniardSpanishSpanish AmericanSpanish American IndianSri LankanSubsaharan AfricanSudaneseSwedishSwissSyrianTaiwaneseThaiTlingit-HaidaTohono O'OdhamTonganTrinidadian and TobagonianTsimshianTurkishU.S. Virgin IslanderUgandanUkrainianUruguayanUteVenezuelanVietnameseWelshWest IndianYakamaYaquiYugoslavianYumanYup'ikZimbabwean
Immigration
NonimmigrantsImmigrantsAfghanistanAfricaAlbaniaArgentinaArmeniaAsiaAustraliaAustriaBahamasBangladeshBarbadosBelarusBelgiumBelizeBoliviaBosnia and HerzegovinaBrazilBulgariaBurma/MyanmarCabo VerdeCambodiaCameroonCanadaCaribbeanCentral AmericaChileChinaColombiaCongoCosta RicaCroatiaCubaCzechoslovakiaDenmarkDominicaDominican RepublicEastern AfricaEastern AsiaEastern EuropeEcuadorEgyptEl SalvadorEnglandEritreaEthiopiaEuropeFijiFranceGermanyGhanaGreeceGrenadaGuatemalaGuyanaHaitiHondurasHong KongHungaryIndiaIndonesiaIranIraqIrelandIsraelItalyJamaicaJapanJordanKazakhstanKenyaKoreaKuwaitLaosLatin AmericaLatviaLebanonLiberiaLithuaniaMalaysiaMexicoMicronesiaMiddle AfricaMoldovaMoroccoNepalNetherlandsNicaraguaNigeriaNorth AmericaNorth MacedoniaNorthern AfricaNorthern EuropeNorwayOceaniaPakistanPanamaPeruPhilippinesPolandPortugalRomaniaRussiaSaudi ArabiaScotlandSenegalSerbiaSierra LeoneSingaporeSomaliaSouth AfricaSouth AmericaSouth Central AsiaSouth Eastern AsiaSouthern EuropeSpainSri LankaSt. Vincent and the GrenadinesSudanSwedenSwitzerlandSyriaTaiwanThailandTrinidad and TobagoTurkeyUgandaUkraineUruguayUzbekistanVenezuelaVietnamWest IndiesWestern AfricaWestern AsiaWestern EuropeYemenZaireZimbabweAzores
Select to Compare
Race
Ancestry
AfghanAfricanAlaska NativeAlaskan AthabascanAlbanianAleutAlsatianAmericanApacheArabArapahoArgentineanArmenianAssyrian/Chaldean/SyriacAustralianAustrianBahamianBangladeshiBarbadianBasqueBelgianBelizeanBermudanBhutaneseBlackfeetBolivianBrazilianBritishBritish West IndianBulgarianBurmeseCajunCambodianCanadianCape VerdeanCarpatho RusynCelticCentral AmericanCentral American IndianCherokeeCheyenneChickasawChileanChineseChippewaChoctawColombianColvilleComancheCosta RicanCreeCreekCroatianCrowCubanCypriotCzechCzechoslovakianDanishDelawareDominicanDutchEastern EuropeanEcuadorianEgyptianEnglishEstonianEthiopianEuropeanFijianFilipinoFinnishFrenchFrench American IndianFrench CanadianGermanGerman RussianGhanaianGreekGuamanian/ChamorroGuatemalanGuyaneseHaitianHmongHonduranHopiHoumaHungarianIcelanderIndian (Asian)IndonesianInupiatIranianIraqiIrishIroquoisIsraeliItalianJamaicanJapaneseJordanianKenyanKiowaKoreanLaotianLatvianLebaneseLiberianLithuanianLumbeeLuxembourgerMacedonianMalaysianMalteseMarshalleseMenomineeMexicanMexican American IndianMongolianMoroccanNative HawaiianNavajoNepaleseNew ZealanderNicaraguanNigerianNorthern EuropeanNorwegianOkinawanOsageOttawaPaiutePakistaniPalestinianPanamanianParaguayanPennsylvania GermanPeruvianPimaPolishPortuguesePotawatomiPuebloPuerto RicanPuget Sound SalishRomanianRussianSalvadoranSamoanScandinavianScotch-IrishScottishSeminoleSenegaleseSerbianShoshoneSierra LeoneanSiouxSlavicSlovakSloveneSomaliSouth AfricanSouth AmericanSouth American IndianSoviet UnionSpaniardSpanishSpanish AmericanSpanish American IndianSri LankanSubsaharan AfricanSudaneseSwedishSwissSyrianTaiwaneseThaiTlingit-HaidaTohono O'OdhamTonganTrinidadian and TobagonianTsimshianTurkishU.S. Virgin IslanderUgandanUkrainianUruguayanUteVenezuelanVietnameseWelshWest IndianYakamaYaquiYugoslavianYumanYup'ikZimbabwean
Immigration
NonimmigrantsImmigrantsAfghanistanAfricaAlbaniaArgentinaArmeniaAsiaAustraliaAustriaBahamasBangladeshBarbadosBelarusBelgiumBelizeBoliviaBosnia and HerzegovinaBrazilBulgariaBurma/MyanmarCabo VerdeCambodiaCameroonCanadaCaribbeanCentral AmericaChileChinaColombiaCongoCosta RicaCroatiaCubaCzechoslovakiaDenmarkDominicaDominican RepublicEastern AfricaEastern AsiaEastern EuropeEcuadorEgyptEl SalvadorEnglandEritreaEthiopiaEuropeFijiFranceGermanyGhanaGreeceGrenadaGuatemalaGuyanaHaitiHondurasHong KongHungaryIndiaIndonesiaIranIraqIrelandIsraelItalyJamaicaJapanJordanKazakhstanKenyaKoreaKuwaitLaosLatin AmericaLatviaLebanonLiberiaLithuaniaMalaysiaMexicoMicronesiaMiddle AfricaMoldovaMoroccoNepalNetherlandsNicaraguaNigeriaNorth AmericaNorth MacedoniaNorthern AfricaNorthern EuropeNorwayOceaniaPakistanPanamaPeruPhilippinesPolandPortugalRomaniaRussiaSaudi ArabiaScotlandSenegalSerbiaSierra LeoneSingaporeSomaliaSouth AfricaSouth AmericaSouth Central AsiaSouth Eastern AsiaSouthern EuropeSpainSri LankaSt. Vincent and the GrenadinesSudanSwedenSwitzerlandSyriaTaiwanThailandTrinidad and TobagoTurkeyUgandaUkraineUruguayUzbekistanVenezuelaVietnamWest IndiesWestern AfricaWestern AsiaWestern EuropeYemenZaireZimbabweAzores
GED/Equivalency
Income
Poverty
Unemployment
Labor Participation
Family Structure
Vehicle Availability
Education Level
Disability

Dutch West Indian GED/Equivalency
Tragic

81.6%
GED/EQUIVALENCY
0.0/ 100
METRIC RATING
301st/ 347
METRIC RANK

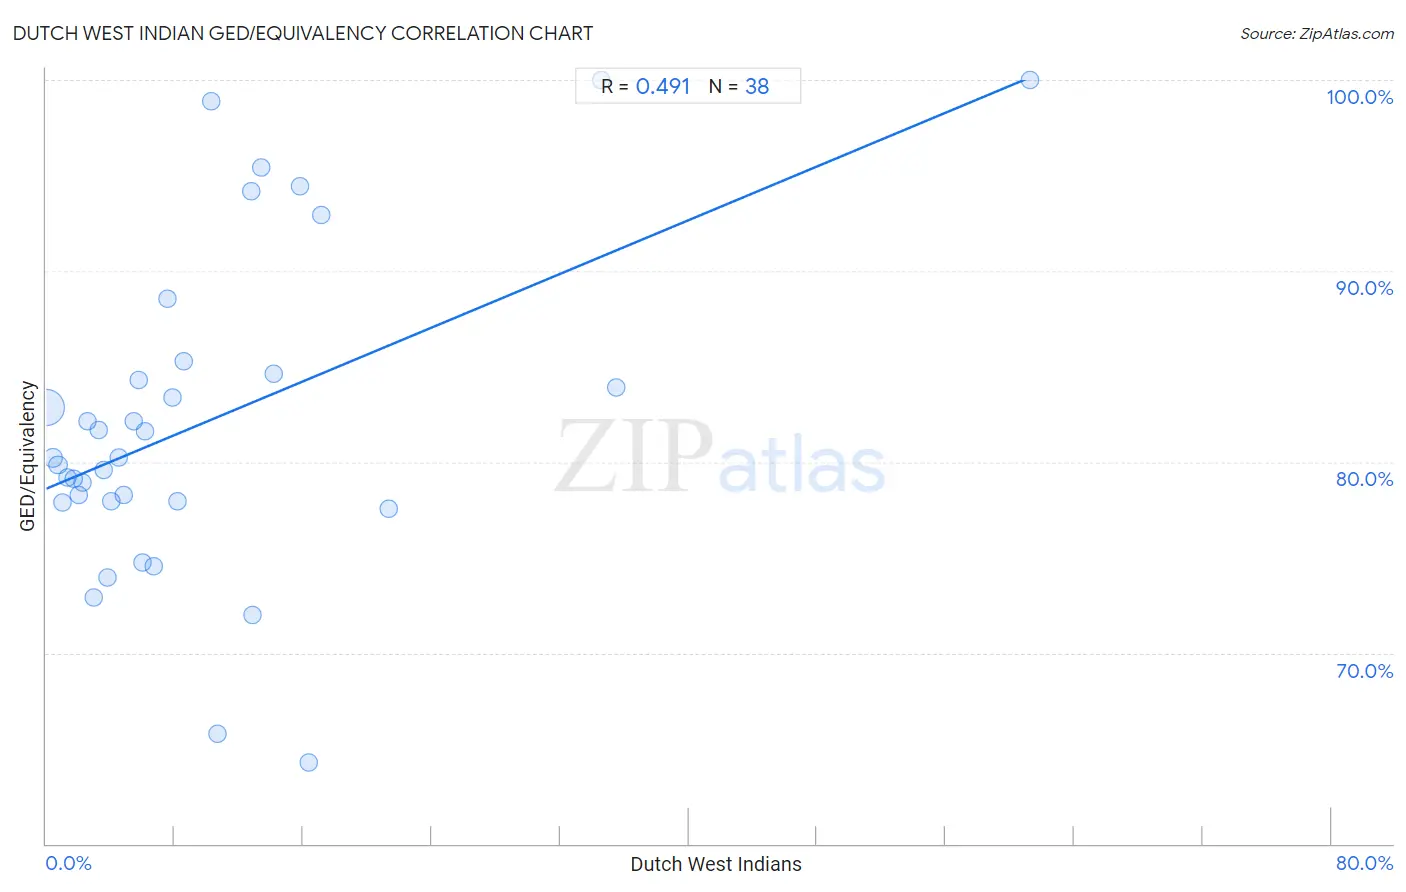
Dutch West Indian GED/Equivalency Correlation Chart

The statistical analysis conducted on geographies consisting of 85,776,098 people shows a moderate positive correlation between the proportion of Dutch West Indians and percentage of population with at least ged/equivalency education in the United States with a correlation coefficient (R) of 0.491 and weighted average of 81.6%. On average, for every 1% (one percent) increase in Dutch West Indians within a typical geography, there is an increase of 0.35% in percentage of population with at least ged/equivalency education.
Dutch West Indian GED/Equivalency
It is essential to understand that the correlation between the percentage of Dutch West Indians and percentage of population with at least ged/equivalency education does not imply a direct cause-and-effect relationship. It remains uncertain whether the presence of Dutch West Indians influences an upward or downward trend in the level of percentage of population with at least ged/equivalency education within an area, or if Dutch West Indians simply ended up residing in those areas with higher or lower levels of percentage of population with at least ged/equivalency education due to other factors.

Demographics Similar to Dutch West Indians by GED/Equivalency

In terms of ged/equivalency, the demographic groups most similar to Dutch West Indians are Immigrants from Haiti (81.6%, a difference of 0.040%), Immigrants from Portugal (81.6%, a difference of 0.040%), Fijian (81.6%, a difference of 0.060%), Ecuadorian (81.7%, a difference of 0.13%), and Navajo (81.5%, a difference of 0.14%).
DemographicsRating | RankGED/Equivalency
Immigrants from St. Vincent and the Grenadines
0.0
/100
|
#294
Tragic
82.0%
Nepalese
0.0
/100
|
#295
Tragic
81.9%
Vietnamese
0.0
/100
|
#296
Tragic
81.9%
Immigrants from Bangladesh
0.0
/100
|
#297
Tragic
81.9%
Ute
0.0
/100
|
#298
Tragic
81.8%
Ecuadorians
0.0
/100
|
#299
Tragic
81.7%
Fijians
0.0
/100
|
#300
Tragic
81.6%
Dutch West Indians
0.0
/100
|
#301
Tragic
81.6%
Immigrants from Haiti
0.0
/100
|
#302
Tragic
81.6%
Immigrants from Portugal
0.0
/100
|
#303
Tragic
81.6%
Navajo
0.0
/100
|
#304
Tragic
81.5%
Immigrants from Grenada
0.0
/100
|
#305
Tragic
81.3%
Guyanese
0.0
/100
|
#306
Tragic
81.3%
Immigrants from Dominica
0.0
/100
|
#307
Tragic
81.1%
Puerto Ricans
0.0
/100
|
#308
Tragic
81.1%

Dutch West Indian GED/Equivalency Correlation Summary

MeasurementDutch West Indian DataGED/Equivalency Data
Minimum0.033%64.3%
Maximum61.3%100.0%
Range61.2%35.7%
Mean9.9%82.1%
Median6.1%80.2%
Interquartile 25% (IQ1)3.0%78.0%
Interquartile 75% (IQ3)12.9%84.6%
Interquartile Range (IQR)9.9%6.7%
Standard Deviation (Sample)11.9%8.5%
Standard Deviation (Population)11.7%8.4%

Correlation Details

Dutch West Indian PercentileSample SizeGED/Equivalency
[
0.0%
-
0.5%
]
0.033%
82,980,43382.8%
[
0.0%
-
0.5%
]
0.42%
1,813,83080.2%
[
0.5%
-
1.0%
]
0.74%
493,57179.8%
[
1.0%
-
1.5%
]
1.05%
187,82777.9%
[
1.0%
-
1.5%
]
1.35%
99,79379.2%
[
1.5%
-
2.0%
]
1.68%
61,31379.1%
[
2.0%
-
2.5%
]
2.00%
43,75378.2%
[
2.0%
-
2.5%
]
2.28%
14,71678.9%
[
2.5%
-
3.0%
]
2.59%
27,52382.1%
[
2.5%
-
3.0%
]
2.95%
12,59372.9%
[
3.0%
-
3.5%
]
3.24%
10,00981.7%
[
3.5%
-
4.0%
]
3.57%
6,28179.6%
[
3.5%
-
4.0%
]
3.80%
3,15973.9%
[
4.0%
-
4.5%
]
4.07%
6,71478.0%
[
4.5%
-
5.0%
]
4.53%
1,03780.2%
[
4.5%
-
5.0%
]
4.84%
2,95378.3%
[
5.0%
-
5.5%
]
5.44%
1,14082.1%
[
5.5%
-
6.0%
]
5.75%
1,46284.3%
[
5.5%
-
6.0%
]
5.98%
51874.7%
[
6.0%
-
6.5%
]
6.18%
72881.6%
[
6.5%
-
7.0%
]
6.67%
40574.5%
[
7.5%
-
8.0%
]
7.58%
1,06988.6%
[
7.5%
-
8.0%
]
7.89%
1,42083.4%
[
8.0%
-
8.5%
]
8.17%
20878.0%
[
8.5%
-
9.0%
]
8.55%
1,21685.3%
[
10.0%
-
10.5%
]
10.27%
29298.9%
[
10.5%
-
11.0%
]
10.64%
4765.8%
[
12.5%
-
13.0%
]
12.76%
43994.2%
[
12.5%
-
13.0%
]
12.88%
13272.0%
[
13.0%
-
13.5%
]
13.42%
31395.4%
[
14.0%
-
14.5%
]
14.20%
31784.6%
[
15.5%
-
16.0%
]
15.79%
1994.4%
[
16.0%
-
16.5%
]
16.36%
5564.3%
[
17.0%
-
17.5%
]
17.14%
38592.9%
[
21.0%
-
21.5%
]
21.35%
8977.6%
[
34.5%
-
35.0%
]
34.52%
197100.0%
[
35.0%
-
35.5%
]
35.48%
3183.9%
[
61.0%
-
61.5%
]
61.26%
111100.0%