Dutch West Indian 1 or more Vehicles in Household

COMPARE

Dutch West Indian
Race
Ancestry
AfghanAfricanAlaska NativeAlaskan AthabascanAlbanianAleutAlsatianAmericanApacheArabArapahoArgentineanArmenianAssyrian/Chaldean/SyriacAustralianAustrianBahamianBangladeshiBarbadianBasqueBelgianBelizeanBermudanBhutaneseBlackfeetBolivianBrazilianBritishBritish West IndianBulgarianBurmeseCajunCambodianCanadianCape VerdeanCarpatho RusynCelticCentral AmericanCentral American IndianCherokeeCheyenneChickasawChileanChineseChippewaChoctawColombianColvilleComancheCosta RicanCreeCreekCroatianCrowCubanCypriotCzechCzechoslovakianDanishDelawareDominicanDutchDutch West IndianEastern EuropeanEcuadorianEgyptianEnglishEstonianEthiopianEuropeanFijianFilipinoFinnishFrenchFrench American IndianFrench CanadianGermanGerman RussianGhanaianGreekGuamanian/ChamorroGuatemalanGuyaneseHaitianHmongHonduranHopiHoumaHungarianIcelanderIndian (Asian)IndonesianInupiatIranianIraqiIrishIroquoisIsraeliItalianJamaicanJapaneseJordanianKenyanKiowaKoreanLaotianLatvianLebaneseLiberianLithuanianLumbeeLuxembourgerMacedonianMalaysianMalteseMarshalleseMenomineeMexicanMexican American IndianMongolianMoroccanNative HawaiianNavajoNepaleseNew ZealanderNicaraguanNigerianNorthern EuropeanNorwegianOkinawanOsageOttawaPaiutePakistaniPalestinianPanamanianParaguayanPennsylvania GermanPeruvianPimaPolishPortuguesePotawatomiPuebloPuerto RicanPuget Sound SalishRomanianRussianSalvadoranSamoanScandinavianScotch-IrishScottishSeminoleSenegaleseSerbianShoshoneSierra LeoneanSiouxSlavicSlovakSloveneSomaliSouth AfricanSouth AmericanSouth American IndianSoviet UnionSpaniardSpanishSpanish AmericanSpanish American IndianSri LankanSubsaharan AfricanSudaneseSwedishSwissSyrianTaiwaneseThaiTlingit-HaidaTohono O'OdhamTonganTrinidadian and TobagonianTsimshianTurkishU.S. Virgin IslanderUgandanUkrainianUruguayanUteVenezuelanVietnameseWelshWest IndianYakamaYaquiYugoslavianYumanYup'ikZimbabwean
Immigration
NonimmigrantsImmigrantsAfghanistanAfricaAlbaniaArgentinaArmeniaAsiaAustraliaAustriaBahamasBangladeshBarbadosBelarusBelgiumBelizeBoliviaBosnia and HerzegovinaBrazilBulgariaBurma/MyanmarCabo VerdeCambodiaCameroonCanadaCaribbeanCentral AmericaChileChinaColombiaCongoCosta RicaCroatiaCubaCzechoslovakiaDenmarkDominicaDominican RepublicEastern AfricaEastern AsiaEastern EuropeEcuadorEgyptEl SalvadorEnglandEritreaEthiopiaEuropeFijiFranceGermanyGhanaGreeceGrenadaGuatemalaGuyanaHaitiHondurasHong KongHungaryIndiaIndonesiaIranIraqIrelandIsraelItalyJamaicaJapanJordanKazakhstanKenyaKoreaKuwaitLaosLatin AmericaLatviaLebanonLiberiaLithuaniaMalaysiaMexicoMicronesiaMiddle AfricaMoldovaMoroccoNepalNetherlandsNicaraguaNigeriaNorth AmericaNorth MacedoniaNorthern AfricaNorthern EuropeNorwayOceaniaPakistanPanamaPeruPhilippinesPolandPortugalRomaniaRussiaSaudi ArabiaScotlandSenegalSerbiaSierra LeoneSingaporeSomaliaSouth AfricaSouth AmericaSouth Central AsiaSouth Eastern AsiaSouthern EuropeSpainSri LankaSt. Vincent and the GrenadinesSudanSwedenSwitzerlandSyriaTaiwanThailandTrinidad and TobagoTurkeyUgandaUkraineUruguayUzbekistanVenezuelaVietnamWest IndiesWestern AfricaWestern AsiaWestern EuropeYemenZaireZimbabweAzores
Select to Compare
Race
Ancestry
AfghanAfricanAlaska NativeAlaskan AthabascanAlbanianAleutAlsatianAmericanApacheArabArapahoArgentineanArmenianAssyrian/Chaldean/SyriacAustralianAustrianBahamianBangladeshiBarbadianBasqueBelgianBelizeanBermudanBhutaneseBlackfeetBolivianBrazilianBritishBritish West IndianBulgarianBurmeseCajunCambodianCanadianCape VerdeanCarpatho RusynCelticCentral AmericanCentral American IndianCherokeeCheyenneChickasawChileanChineseChippewaChoctawColombianColvilleComancheCosta RicanCreeCreekCroatianCrowCubanCypriotCzechCzechoslovakianDanishDelawareDominicanDutchEastern EuropeanEcuadorianEgyptianEnglishEstonianEthiopianEuropeanFijianFilipinoFinnishFrenchFrench American IndianFrench CanadianGermanGerman RussianGhanaianGreekGuamanian/ChamorroGuatemalanGuyaneseHaitianHmongHonduranHopiHoumaHungarianIcelanderIndian (Asian)IndonesianInupiatIranianIraqiIrishIroquoisIsraeliItalianJamaicanJapaneseJordanianKenyanKiowaKoreanLaotianLatvianLebaneseLiberianLithuanianLumbeeLuxembourgerMacedonianMalaysianMalteseMarshalleseMenomineeMexicanMexican American IndianMongolianMoroccanNative HawaiianNavajoNepaleseNew ZealanderNicaraguanNigerianNorthern EuropeanNorwegianOkinawanOsageOttawaPaiutePakistaniPalestinianPanamanianParaguayanPennsylvania GermanPeruvianPimaPolishPortuguesePotawatomiPuebloPuerto RicanPuget Sound SalishRomanianRussianSalvadoranSamoanScandinavianScotch-IrishScottishSeminoleSenegaleseSerbianShoshoneSierra LeoneanSiouxSlavicSlovakSloveneSomaliSouth AfricanSouth AmericanSouth American IndianSoviet UnionSpaniardSpanishSpanish AmericanSpanish American IndianSri LankanSubsaharan AfricanSudaneseSwedishSwissSyrianTaiwaneseThaiTlingit-HaidaTohono O'OdhamTonganTrinidadian and TobagonianTsimshianTurkishU.S. Virgin IslanderUgandanUkrainianUruguayanUteVenezuelanVietnameseWelshWest IndianYakamaYaquiYugoslavianYumanYup'ikZimbabwean
Immigration
NonimmigrantsImmigrantsAfghanistanAfricaAlbaniaArgentinaArmeniaAsiaAustraliaAustriaBahamasBangladeshBarbadosBelarusBelgiumBelizeBoliviaBosnia and HerzegovinaBrazilBulgariaBurma/MyanmarCabo VerdeCambodiaCameroonCanadaCaribbeanCentral AmericaChileChinaColombiaCongoCosta RicaCroatiaCubaCzechoslovakiaDenmarkDominicaDominican RepublicEastern AfricaEastern AsiaEastern EuropeEcuadorEgyptEl SalvadorEnglandEritreaEthiopiaEuropeFijiFranceGermanyGhanaGreeceGrenadaGuatemalaGuyanaHaitiHondurasHong KongHungaryIndiaIndonesiaIranIraqIrelandIsraelItalyJamaicaJapanJordanKazakhstanKenyaKoreaKuwaitLaosLatin AmericaLatviaLebanonLiberiaLithuaniaMalaysiaMexicoMicronesiaMiddle AfricaMoldovaMoroccoNepalNetherlandsNicaraguaNigeriaNorth AmericaNorth MacedoniaNorthern AfricaNorthern EuropeNorwayOceaniaPakistanPanamaPeruPhilippinesPolandPortugalRomaniaRussiaSaudi ArabiaScotlandSenegalSerbiaSierra LeoneSingaporeSomaliaSouth AfricaSouth AmericaSouth Central AsiaSouth Eastern AsiaSouthern EuropeSpainSri LankaSt. Vincent and the GrenadinesSudanSwedenSwitzerlandSyriaTaiwanThailandTrinidad and TobagoTurkeyUgandaUkraineUruguayUzbekistanVenezuelaVietnamWest IndiesWestern AfricaWestern AsiaWestern EuropeYemenZaireZimbabweAzores
1 or more Vehicles in Household
Income
Poverty
Unemployment
Labor Participation
Family Structure
Vehicle Availability
Education Level
Disability

Dutch West Indian 1 or more Vehicles in Household
Poor

89.0%
1+ VEHICLES AVAILABLE
13.5/ 100
METRIC RATING
210th/ 347
METRIC RANK

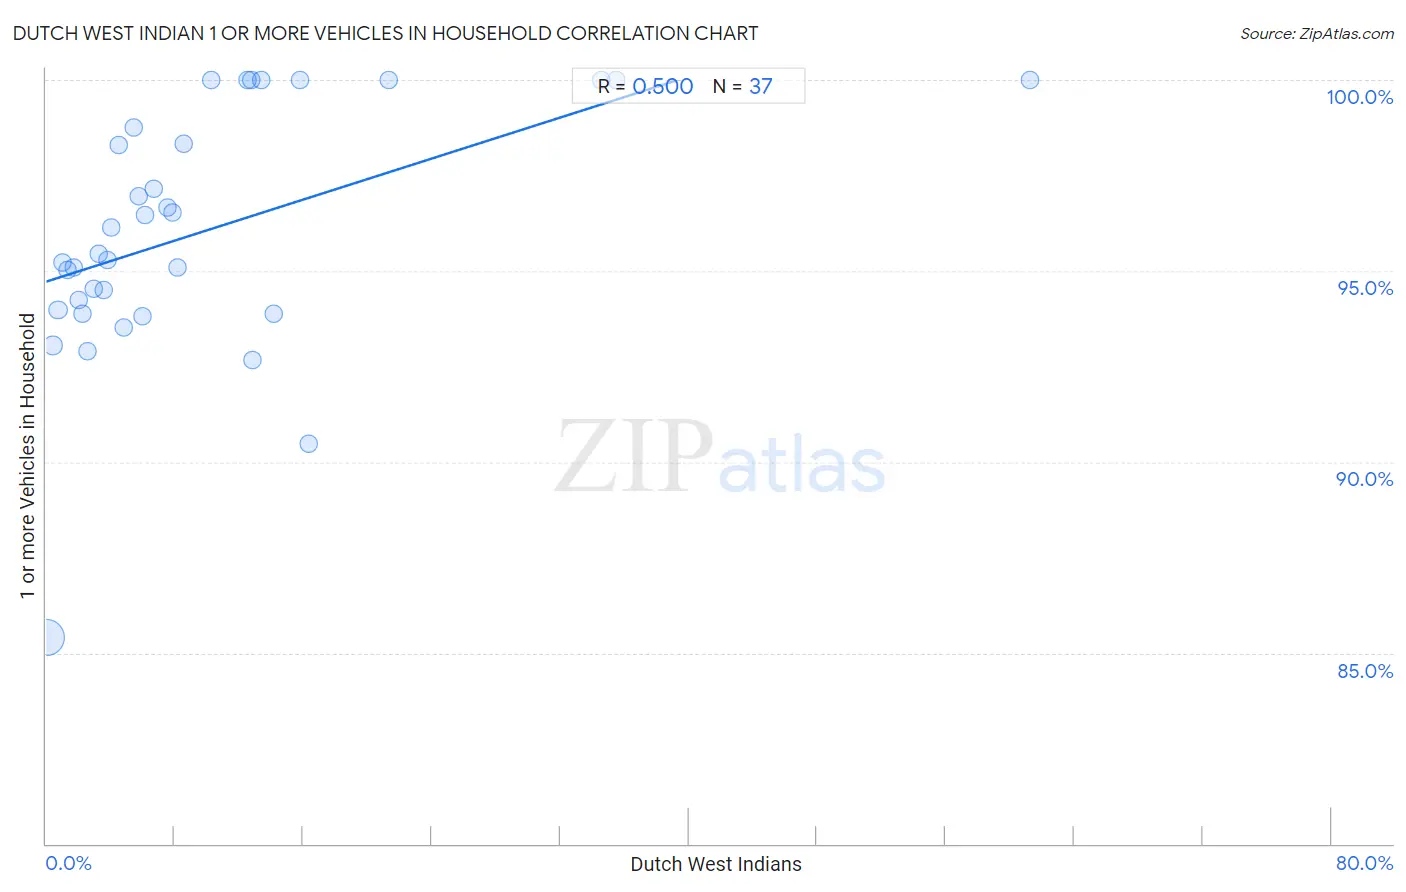
Dutch West Indian 1 or more Vehicles in Household Correlation Chart

The statistical analysis conducted on geographies consisting of 85,766,145 people shows a moderate positive correlation between the proportion of Dutch West Indians and percentage of households with 1 or more vehicles available in the United States with a correlation coefficient (R) of 0.500 and weighted average of 89.0%. On average, for every 1% (one percent) increase in Dutch West Indians within a typical geography, there is an increase of 0.13% in percentage of households with 1 or more vehicles available.
Dutch West Indian 1 or more Vehicles in Household
It is essential to understand that the correlation between the percentage of Dutch West Indians and percentage of households with 1 or more vehicles available does not imply a direct cause-and-effect relationship. It remains uncertain whether the presence of Dutch West Indians influences an upward or downward trend in the level of percentage of households with 1 or more vehicles available within an area, or if Dutch West Indians simply ended up residing in those areas with higher or lower levels of percentage of households with 1 or more vehicles available due to other factors.

Demographics Similar to Dutch West Indians by 1 or more Vehicles in Household

In terms of 1 or more vehicles in household, the demographic groups most similar to Dutch West Indians are Immigrants from Italy (89.1%, a difference of 0.020%), Sierra Leonean (89.0%, a difference of 0.020%), Immigrants from Chile (89.1%, a difference of 0.030%), Somali (89.0%, a difference of 0.030%), and Immigrants from Denmark (89.1%, a difference of 0.040%).
DemographicsRating | Rank1 or more Vehicles in Household
Cambodians
18.9
/100
|
#203
Poor
89.2%
Romanians
18.2
/100
|
#204
Poor
89.2%
Guatemalans
17.8
/100
|
#205
Poor
89.2%
Apache
16.2
/100
|
#206
Poor
89.1%
Immigrants from Denmark
14.8
/100
|
#207
Poor
89.1%
Immigrants from Chile
14.4
/100
|
#208
Poor
89.1%
Immigrants from Italy
14.0
/100
|
#209
Poor
89.1%
Dutch West Indians
13.5
/100
|
#210
Poor
89.0%
Sierra Leoneans
13.0
/100
|
#211
Poor
89.0%
Somalis
12.8
/100
|
#212
Poor
89.0%
Immigrants from Western Asia
12.3
/100
|
#213
Poor
89.0%
Immigrants from Hungary
11.9
/100
|
#214
Poor
89.0%
Immigrants from Sri Lanka
10.2
/100
|
#215
Poor
88.9%
Immigrants from Argentina
9.4
/100
|
#216
Tragic
88.9%
Argentineans
8.8
/100
|
#217
Tragic
88.9%

Dutch West Indian 1 or more Vehicles in Household Correlation Summary

MeasurementDutch West Indian Data1 or more Vehicles in Household Data
Minimum0.033%85.4%
Maximum61.3%100.0%
Range61.2%14.6%
Mean9.8%96.0%
Median6.0%95.4%
Interquartile 25% (IQ1)2.8%93.9%
Interquartile 75% (IQ3)12.8%99.4%
Interquartile Range (IQR)10.0%5.4%
Standard Deviation (Sample)12.0%3.2%
Standard Deviation (Population)11.8%3.2%

Correlation Details

Dutch West Indian PercentileSample Size1 or more Vehicles in Household
[
0.0%
-
0.5%
]
0.033%
82,977,92585.4%
[
0.0%
-
0.5%
]
0.42%
1,810,29593.0%
[
0.5%
-
1.0%
]
0.74%
492,15094.0%
[
1.0%
-
1.5%
]
1.05%
186,06395.2%
[
1.0%
-
1.5%
]
1.35%
99,79395.0%
[
1.5%
-
2.0%
]
1.68%
61,31395.1%
[
2.0%
-
2.5%
]
2.00%
43,75394.2%
[
2.0%
-
2.5%
]
2.28%
14,71693.9%
[
2.5%
-
3.0%
]
2.60%
27,20692.9%
[
2.5%
-
3.0%
]
2.95%
12,59394.5%
[
3.0%
-
3.5%
]
3.24%
10,00995.4%
[
3.5%
-
4.0%
]
3.57%
6,28194.5%
[
3.5%
-
4.0%
]
3.80%
3,15995.3%
[
4.0%
-
4.5%
]
4.07%
6,71496.1%
[
4.5%
-
5.0%
]
4.53%
1,03798.3%
[
4.5%
-
5.0%
]
4.84%
2,95393.5%
[
5.0%
-
5.5%
]
5.44%
1,14098.8%
[
5.5%
-
6.0%
]
5.75%
1,46297.0%
[
5.5%
-
6.0%
]
5.98%
51893.8%
[
6.0%
-
6.5%
]
6.18%
72896.5%
[
6.5%
-
7.0%
]
6.67%
40597.1%
[
7.5%
-
8.0%
]
7.58%
1,06996.7%
[
7.5%
-
8.0%
]
7.89%
1,42096.5%
[
8.0%
-
8.5%
]
8.17%
20895.1%
[
8.5%
-
9.0%
]
8.55%
1,21698.3%
[
10.0%
-
10.5%
]
10.27%
292100.0%
[
12.0%
-
12.5%
]
12.50%
24100.0%
[
12.5%
-
13.0%
]
12.76%
439100.0%
[
12.5%
-
13.0%
]
12.88%
13292.7%
[
13.0%
-
13.5%
]
13.42%
313100.0%
[
14.0%
-
14.5%
]
14.20%
31793.9%
[
15.5%
-
16.0%
]
15.79%
19100.0%
[
16.0%
-
16.5%
]
16.36%
5590.5%
[
21.0%
-
21.5%
]
21.35%
89100.0%
[
34.5%
-
35.0%
]
34.52%
197100.0%
[
35.0%
-
35.5%
]
35.48%
31100.0%
[
61.0%
-
61.5%
]
61.26%
111100.0%