Dutch West Indian Disability
COMPARE
Dutch West Indian
Select to Compare
Disability
Dutch West Indian Disability
14.9%
DISABILITY
0.0/ 100
METRIC RATING
338th/ 347
METRIC RANK
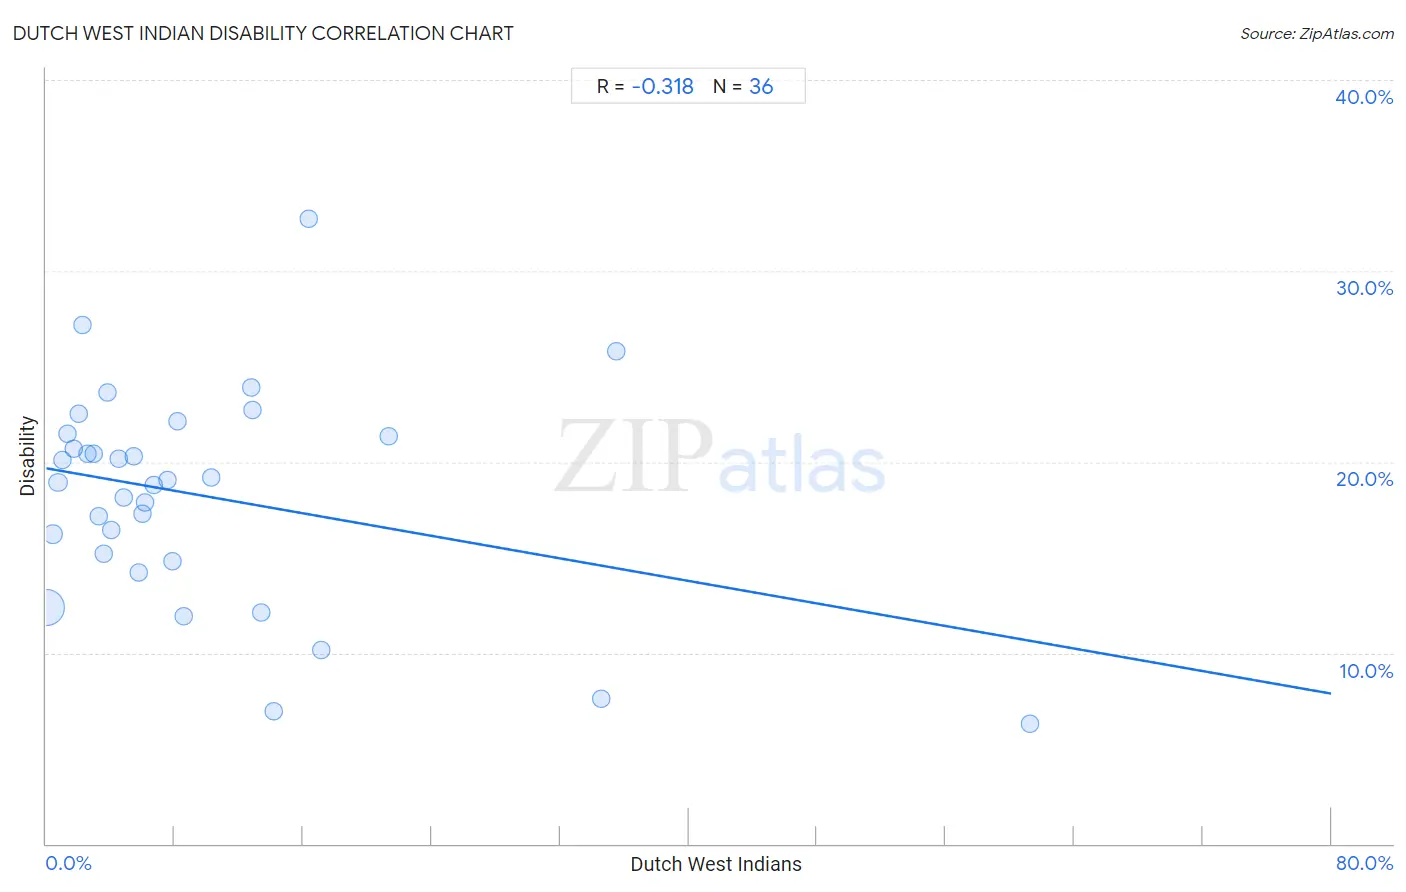
Dutch West Indian Disability Correlation Chart
The statistical analysis conducted on geographies consisting of 85,770,416 people shows a mild negative correlation between the proportion of Dutch West Indians and percentage of population with a disability in the United States with a correlation coefficient (R) of -0.318 and weighted average of 14.9%. On average, for every 1% (one percent) increase in Dutch West Indians within a typical geography, there is a decrease of 0.15% in percentage of population with a disability.
It is essential to understand that the correlation between the percentage of Dutch West Indians and percentage of population with a disability does not imply a direct cause-and-effect relationship. It remains uncertain whether the presence of Dutch West Indians influences an upward or downward trend in the level of percentage of population with a disability within an area, or if Dutch West Indians simply ended up residing in those areas with higher or lower levels of percentage of population with a disability due to other factors.
Demographics Similar to Dutch West Indians by Disability
In terms of disability, the demographic groups most similar to Dutch West Indians are Seminole (14.9%, a difference of 0.30%), Cherokee (14.8%, a difference of 0.39%), Tohono O'odham (14.8%, a difference of 0.91%), Chickasaw (15.2%, a difference of 1.8%), and Yuman (14.6%, a difference of 1.9%).
| Demographics | Rating | Rank | Disability |
| Alaskan Athabascans | 0.0 /100 | #331 | Tragic 14.4% |
| Pueblo | 0.0 /100 | #332 | Tragic 14.4% |
| Cajuns | 0.0 /100 | #333 | Tragic 14.6% |
| Yuman | 0.0 /100 | #334 | Tragic 14.6% |
| Tohono O'odham | 0.0 /100 | #335 | Tragic 14.8% |
| Cherokee | 0.0 /100 | #336 | Tragic 14.8% |
| Seminole | 0.0 /100 | #337 | Tragic 14.9% |
| Dutch West Indians | 0.0 /100 | #338 | Tragic 14.9% |
| Chickasaw | 0.0 /100 | #339 | Tragic 15.2% |
| Choctaw | 0.0 /100 | #340 | Tragic 15.4% |
| Lumbee | 0.0 /100 | #341 | Tragic 15.5% |
| Kiowa | 0.0 /100 | #342 | Tragic 15.6% |
| Creek | 0.0 /100 | #343 | Tragic 15.6% |
| Colville | 0.0 /100 | #344 | Tragic 15.8% |
| Puerto Ricans | 0.0 /100 | #345 | Tragic 16.1% |
Dutch West Indian Disability Correlation Summary
| Measurement | Dutch West Indian Data | Disability Data |
| Minimum | 0.033% | 6.3% |
| Maximum | 61.3% | 32.7% |
| Range | 61.2% | 26.4% |
| Mean | 9.7% | 18.2% |
| Median | 5.9% | 19.0% |
| Interquartile 25% (IQ1) | 2.8% | 15.0% |
| Interquartile 75% (IQ3) | 12.8% | 21.4% |
| Interquartile Range (IQR) | 10.0% | 6.4% |
| Standard Deviation (Sample) | 12.2% | 5.7% |
| Standard Deviation (Population) | 12.0% | 5.6% |
Correlation Details
| Dutch West Indian Percentile | Sample Size | Disability |
[ 0.0% - 0.5% ] 0.033% | 82,980,433 | 12.4% |
[ 0.0% - 0.5% ] 0.42% | 1,810,295 | 16.2% |
[ 0.5% - 1.0% ] 0.74% | 493,571 | 18.9% |
[ 1.0% - 1.5% ] 1.05% | 186,063 | 20.1% |
[ 1.0% - 1.5% ] 1.35% | 99,793 | 21.5% |
[ 1.5% - 2.0% ] 1.68% | 61,313 | 20.7% |
[ 2.0% - 2.5% ] 2.00% | 43,753 | 22.5% |
[ 2.0% - 2.5% ] 2.28% | 14,716 | 27.2% |
[ 2.5% - 3.0% ] 2.60% | 27,206 | 20.4% |
[ 2.5% - 3.0% ] 2.95% | 12,593 | 20.4% |
[ 3.0% - 3.5% ] 3.24% | 10,009 | 17.1% |
[ 3.5% - 4.0% ] 3.57% | 6,281 | 15.2% |
[ 3.5% - 4.0% ] 3.80% | 3,159 | 23.6% |
[ 4.0% - 4.5% ] 4.07% | 6,714 | 16.4% |
[ 4.5% - 5.0% ] 4.53% | 1,037 | 20.2% |
[ 4.5% - 5.0% ] 4.84% | 2,953 | 18.2% |
[ 5.0% - 5.5% ] 5.44% | 1,140 | 20.3% |
[ 5.5% - 6.0% ] 5.75% | 1,462 | 14.2% |
[ 5.5% - 6.0% ] 5.98% | 518 | 17.3% |
[ 6.0% - 6.5% ] 6.18% | 728 | 17.9% |
[ 6.5% - 7.0% ] 6.67% | 405 | 18.8% |
[ 7.5% - 8.0% ] 7.58% | 1,069 | 19.1% |
[ 7.5% - 8.0% ] 7.89% | 1,420 | 14.8% |
[ 8.0% - 8.5% ] 8.17% | 208 | 22.1% |
[ 8.5% - 9.0% ] 8.55% | 1,216 | 11.9% |
[ 10.0% - 10.5% ] 10.27% | 292 | 19.2% |
[ 12.5% - 13.0% ] 12.76% | 439 | 23.9% |
[ 12.5% - 13.0% ] 12.88% | 132 | 22.7% |
[ 13.0% - 13.5% ] 13.42% | 313 | 12.1% |
[ 14.0% - 14.5% ] 14.20% | 317 | 6.9% |
[ 16.0% - 16.5% ] 16.36% | 55 | 32.7% |
[ 17.0% - 17.5% ] 17.14% | 385 | 10.1% |
[ 21.0% - 21.5% ] 21.35% | 89 | 21.3% |
[ 34.5% - 35.0% ] 34.52% | 197 | 7.6% |
[ 35.0% - 35.5% ] 35.48% | 31 | 25.8% |
[ 61.0% - 61.5% ] 61.26% | 111 | 6.3% |