Dutch West Indian 4 or more Vehicles in Household

COMPARE

Dutch West Indian
Race
Ancestry
AfghanAfricanAlaska NativeAlaskan AthabascanAlbanianAleutAlsatianAmericanApacheArabArapahoArgentineanArmenianAssyrian/Chaldean/SyriacAustralianAustrianBahamianBangladeshiBarbadianBasqueBelgianBelizeanBermudanBhutaneseBlackfeetBolivianBrazilianBritishBritish West IndianBulgarianBurmeseCajunCambodianCanadianCape VerdeanCarpatho RusynCelticCentral AmericanCentral American IndianCherokeeCheyenneChickasawChileanChineseChippewaChoctawColombianColvilleComancheCosta RicanCreeCreekCroatianCrowCubanCypriotCzechCzechoslovakianDanishDelawareDominicanDutchDutch West IndianEastern EuropeanEcuadorianEgyptianEnglishEstonianEthiopianEuropeanFijianFilipinoFinnishFrenchFrench American IndianFrench CanadianGermanGerman RussianGhanaianGreekGuamanian/ChamorroGuatemalanGuyaneseHaitianHmongHonduranHopiHoumaHungarianIcelanderIndian (Asian)IndonesianInupiatIranianIraqiIrishIroquoisIsraeliItalianJamaicanJapaneseJordanianKenyanKiowaKoreanLaotianLatvianLebaneseLiberianLithuanianLumbeeLuxembourgerMacedonianMalaysianMalteseMarshalleseMenomineeMexicanMexican American IndianMongolianMoroccanNative HawaiianNavajoNepaleseNew ZealanderNicaraguanNigerianNorthern EuropeanNorwegianOkinawanOsageOttawaPaiutePakistaniPalestinianPanamanianParaguayanPennsylvania GermanPeruvianPimaPolishPortuguesePotawatomiPuebloPuerto RicanPuget Sound SalishRomanianRussianSalvadoranSamoanScandinavianScotch-IrishScottishSeminoleSenegaleseSerbianShoshoneSierra LeoneanSiouxSlavicSlovakSloveneSomaliSouth AfricanSouth AmericanSouth American IndianSoviet UnionSpaniardSpanishSpanish AmericanSpanish American IndianSri LankanSubsaharan AfricanSudaneseSwedishSwissSyrianTaiwaneseThaiTlingit-HaidaTohono O'OdhamTonganTrinidadian and TobagonianTsimshianTurkishU.S. Virgin IslanderUgandanUkrainianUruguayanUteVenezuelanVietnameseWelshWest IndianYakamaYaquiYugoslavianYumanYup'ikZimbabwean
Immigration
NonimmigrantsImmigrantsAfghanistanAfricaAlbaniaArgentinaArmeniaAsiaAustraliaAustriaBahamasBangladeshBarbadosBelarusBelgiumBelizeBoliviaBosnia and HerzegovinaBrazilBulgariaBurma/MyanmarCabo VerdeCambodiaCameroonCanadaCaribbeanCentral AmericaChileChinaColombiaCongoCosta RicaCroatiaCubaCzechoslovakiaDenmarkDominicaDominican RepublicEastern AfricaEastern AsiaEastern EuropeEcuadorEgyptEl SalvadorEnglandEritreaEthiopiaEuropeFijiFranceGermanyGhanaGreeceGrenadaGuatemalaGuyanaHaitiHondurasHong KongHungaryIndiaIndonesiaIranIraqIrelandIsraelItalyJamaicaJapanJordanKazakhstanKenyaKoreaKuwaitLaosLatin AmericaLatviaLebanonLiberiaLithuaniaMalaysiaMexicoMicronesiaMiddle AfricaMoldovaMoroccoNepalNetherlandsNicaraguaNigeriaNorth AmericaNorth MacedoniaNorthern AfricaNorthern EuropeNorwayOceaniaPakistanPanamaPeruPhilippinesPolandPortugalRomaniaRussiaSaudi ArabiaScotlandSenegalSerbiaSierra LeoneSingaporeSomaliaSouth AfricaSouth AmericaSouth Central AsiaSouth Eastern AsiaSouthern EuropeSpainSri LankaSt. Vincent and the GrenadinesSudanSwedenSwitzerlandSyriaTaiwanThailandTrinidad and TobagoTurkeyUgandaUkraineUruguayUzbekistanVenezuelaVietnamWest IndiesWestern AfricaWestern AsiaWestern EuropeYemenZaireZimbabweAzores
Select to Compare
Race
Ancestry
AfghanAfricanAlaska NativeAlaskan AthabascanAlbanianAleutAlsatianAmericanApacheArabArapahoArgentineanArmenianAssyrian/Chaldean/SyriacAustralianAustrianBahamianBangladeshiBarbadianBasqueBelgianBelizeanBermudanBhutaneseBlackfeetBolivianBrazilianBritishBritish West IndianBulgarianBurmeseCajunCambodianCanadianCape VerdeanCarpatho RusynCelticCentral AmericanCentral American IndianCherokeeCheyenneChickasawChileanChineseChippewaChoctawColombianColvilleComancheCosta RicanCreeCreekCroatianCrowCubanCypriotCzechCzechoslovakianDanishDelawareDominicanDutchEastern EuropeanEcuadorianEgyptianEnglishEstonianEthiopianEuropeanFijianFilipinoFinnishFrenchFrench American IndianFrench CanadianGermanGerman RussianGhanaianGreekGuamanian/ChamorroGuatemalanGuyaneseHaitianHmongHonduranHopiHoumaHungarianIcelanderIndian (Asian)IndonesianInupiatIranianIraqiIrishIroquoisIsraeliItalianJamaicanJapaneseJordanianKenyanKiowaKoreanLaotianLatvianLebaneseLiberianLithuanianLumbeeLuxembourgerMacedonianMalaysianMalteseMarshalleseMenomineeMexicanMexican American IndianMongolianMoroccanNative HawaiianNavajoNepaleseNew ZealanderNicaraguanNigerianNorthern EuropeanNorwegianOkinawanOsageOttawaPaiutePakistaniPalestinianPanamanianParaguayanPennsylvania GermanPeruvianPimaPolishPortuguesePotawatomiPuebloPuerto RicanPuget Sound SalishRomanianRussianSalvadoranSamoanScandinavianScotch-IrishScottishSeminoleSenegaleseSerbianShoshoneSierra LeoneanSiouxSlavicSlovakSloveneSomaliSouth AfricanSouth AmericanSouth American IndianSoviet UnionSpaniardSpanishSpanish AmericanSpanish American IndianSri LankanSubsaharan AfricanSudaneseSwedishSwissSyrianTaiwaneseThaiTlingit-HaidaTohono O'OdhamTonganTrinidadian and TobagonianTsimshianTurkishU.S. Virgin IslanderUgandanUkrainianUruguayanUteVenezuelanVietnameseWelshWest IndianYakamaYaquiYugoslavianYumanYup'ikZimbabwean
Immigration
NonimmigrantsImmigrantsAfghanistanAfricaAlbaniaArgentinaArmeniaAsiaAustraliaAustriaBahamasBangladeshBarbadosBelarusBelgiumBelizeBoliviaBosnia and HerzegovinaBrazilBulgariaBurma/MyanmarCabo VerdeCambodiaCameroonCanadaCaribbeanCentral AmericaChileChinaColombiaCongoCosta RicaCroatiaCubaCzechoslovakiaDenmarkDominicaDominican RepublicEastern AfricaEastern AsiaEastern EuropeEcuadorEgyptEl SalvadorEnglandEritreaEthiopiaEuropeFijiFranceGermanyGhanaGreeceGrenadaGuatemalaGuyanaHaitiHondurasHong KongHungaryIndiaIndonesiaIranIraqIrelandIsraelItalyJamaicaJapanJordanKazakhstanKenyaKoreaKuwaitLaosLatin AmericaLatviaLebanonLiberiaLithuaniaMalaysiaMexicoMicronesiaMiddle AfricaMoldovaMoroccoNepalNetherlandsNicaraguaNigeriaNorth AmericaNorth MacedoniaNorthern AfricaNorthern EuropeNorwayOceaniaPakistanPanamaPeruPhilippinesPolandPortugalRomaniaRussiaSaudi ArabiaScotlandSenegalSerbiaSierra LeoneSingaporeSomaliaSouth AfricaSouth AmericaSouth Central AsiaSouth Eastern AsiaSouthern EuropeSpainSri LankaSt. Vincent and the GrenadinesSudanSwedenSwitzerlandSyriaTaiwanThailandTrinidad and TobagoTurkeyUgandaUkraineUruguayUzbekistanVenezuelaVietnamWest IndiesWestern AfricaWestern AsiaWestern EuropeYemenZaireZimbabweAzores
4 or more Vehicles in Household
Income
Poverty
Unemployment
Labor Participation
Family Structure
Vehicle Availability
Education Level
Disability

Dutch West Indian 4 or more Vehicles in Household
Exceptional

7.1%
4+ VEHICLES AVAILABLE
99.3/ 100
METRIC RATING
94th/ 347
METRIC RANK

Dutch West Indian 4 or more Vehicles in Household Correlation Chart

The statistical analysis conducted on geographies consisting of 85,699,538 people shows a near-perfect positive correlation between the proportion of Dutch West Indians and percentage of households with 4 or more vehicles available in the United States with a correlation coefficient (R) of 0.909 and weighted average of 7.1%. On average, for every 1% (one percent) increase in Dutch West Indians within a typical geography, there is an increase of 1.3% in percentage of households with 4 or more vehicles available.
Dutch West Indian 4 or more Vehicles in Household
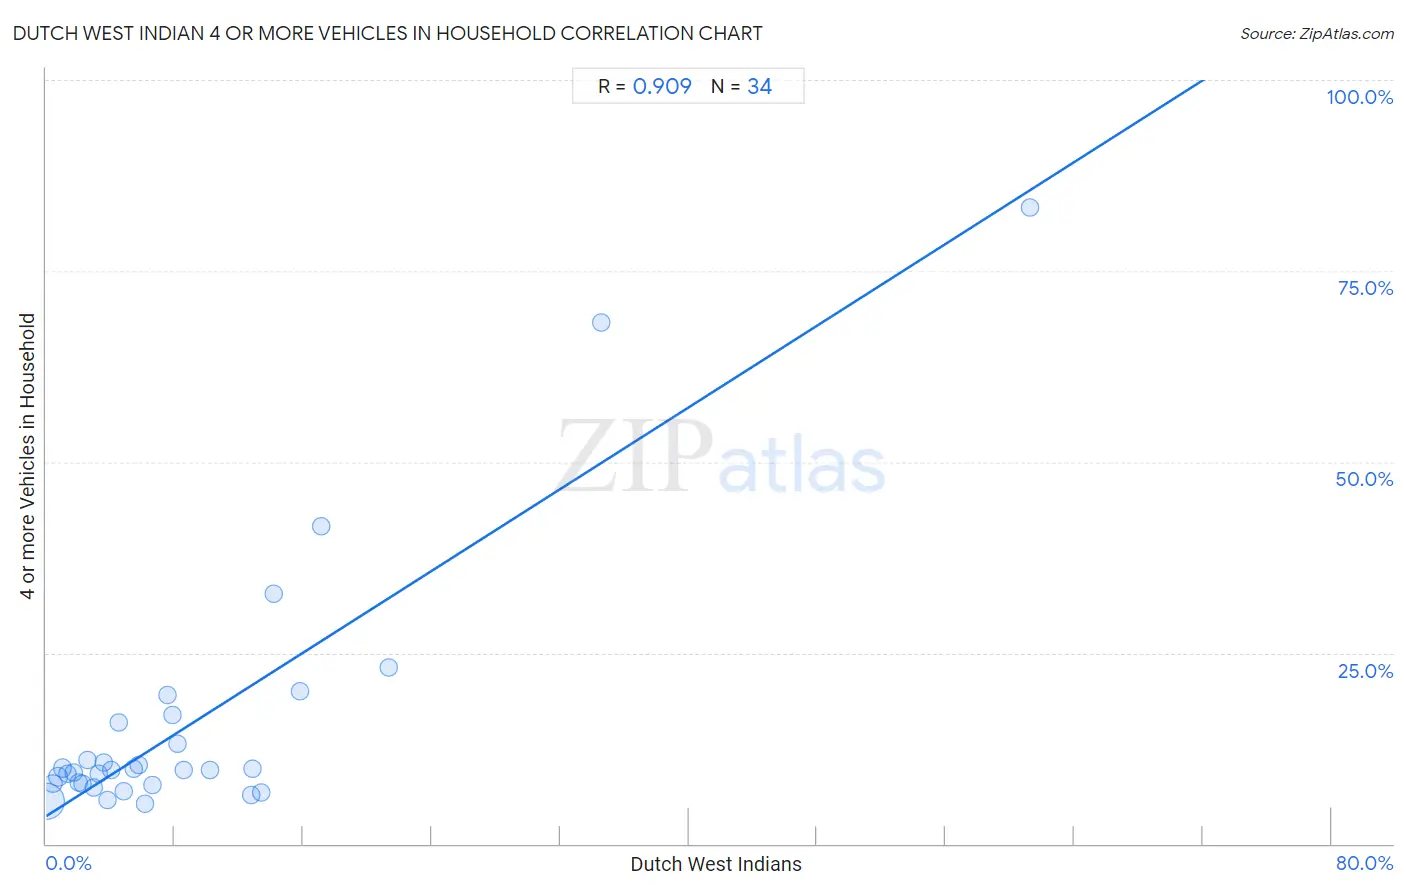
It is essential to understand that the correlation between the percentage of Dutch West Indians and percentage of households with 4 or more vehicles available does not imply a direct cause-and-effect relationship. It remains uncertain whether the presence of Dutch West Indians influences an upward or downward trend in the level of percentage of households with 4 or more vehicles available within an area, or if Dutch West Indians simply ended up residing in those areas with higher or lower levels of percentage of households with 4 or more vehicles available due to other factors.

Demographics Similar to Dutch West Indians by 4 or more Vehicles in Household

In terms of 4 or more vehicles in household, the demographic groups most similar to Dutch West Indians are Immigrants from Afghanistan (7.1%, a difference of 0.010%), Immigrants from Latin America (7.1%, a difference of 0.18%), Czechoslovakian (7.1%, a difference of 0.21%), Central American (7.1%, a difference of 0.23%), and Assyrian/Chaldean/Syriac (7.2%, a difference of 0.34%).
DemographicsRating | Rank4 or more Vehicles in Household
Delaware
99.6
/100
|
#87
Exceptional
7.2%
Nonimmigrants
99.6
/100
|
#88
Exceptional
7.2%
British
99.6
/100
|
#89
Exceptional
7.2%
Creek
99.6
/100
|
#90
Exceptional
7.2%
Assyrians/Chaldeans/Syriacs
99.4
/100
|
#91
Exceptional
7.2%
Immigrants from Latin America
99.4
/100
|
#92
Exceptional
7.1%
Immigrants from Afghanistan
99.3
/100
|
#93
Exceptional
7.1%
Dutch West Indians
99.3
/100
|
#94
Exceptional
7.1%
Czechoslovakians
99.3
/100
|
#95
Exceptional
7.1%
Central Americans
99.3
/100
|
#96
Exceptional
7.1%
Celtics
99.1
/100
|
#97
Exceptional
7.1%
Irish
99.0
/100
|
#98
Exceptional
7.1%
Seminole
98.8
/100
|
#99
Exceptional
7.0%
Taiwanese
98.7
/100
|
#100
Exceptional
7.0%
Pakistanis
98.7
/100
|
#101
Exceptional
7.0%

Dutch West Indian 4 or more Vehicles in Household Correlation Summary

MeasurementDutch West Indian Data4 or more Vehicles in Household Data
Minimum0.033%5.3%
Maximum61.3%83.3%
Range61.2%78.0%
Mean9.1%15.8%
Median5.6%9.7%
Interquartile 25% (IQ1)2.6%7.8%
Interquartile 75% (IQ3)12.8%15.8%
Interquartile Range (IQR)10.2%8.0%
Standard Deviation (Sample)11.7%17.2%
Standard Deviation (Population)11.5%16.9%

Correlation Details

Dutch West Indian PercentileSample Size4 or more Vehicles in Household
[
0.0%
-
0.5%
]
0.033%
82,930,6505.5%
[
0.0%
-
0.5%
]
0.42%
1,796,7897.9%
[
0.5%
-
1.0%
]
0.74%
489,2368.8%
[
1.0%
-
1.5%
]
1.05%
185,8959.9%
[
1.0%
-
1.5%
]
1.35%
99,4949.2%
[
1.5%
-
2.0%
]
1.68%
61,3139.3%
[
2.0%
-
2.5%
]
2.00%
43,0137.9%
[
2.0%
-
2.5%
]
2.28%
14,1397.8%
[
2.5%
-
3.0%
]
2.60%
27,20611.0%
[
2.5%
-
3.0%
]
2.95%
12,5937.4%
[
3.0%
-
3.5%
]
3.24%
10,0099.2%
[
3.5%
-
4.0%
]
3.57%
6,28110.7%
[
3.5%
-
4.0%
]
3.80%
3,0535.7%
[
4.0%
-
4.5%
]
4.07%
6,6169.6%
[
4.5%
-
5.0%
]
4.53%
1,03715.8%
[
4.5%
-
5.0%
]
4.85%
2,7616.9%
[
5.0%
-
5.5%
]
5.47%
9509.8%
[
5.5%
-
6.0%
]
5.75%
1,46210.3%
[
6.0%
-
6.5%
]
6.18%
7285.3%
[
6.5%
-
7.0%
]
6.64%
2417.7%
[
7.5%
-
8.0%
]
7.58%
1,06919.5%
[
7.5%
-
8.0%
]
7.89%
1,42016.8%
[
8.0%
-
8.5%
]
8.17%
20813.1%
[
8.5%
-
9.0%
]
8.55%
1,2169.6%
[
10.0%
-
10.5%
]
10.19%
1579.7%
[
12.5%
-
13.0%
]
12.76%
4396.3%
[
12.5%
-
13.0%
]
12.88%
1329.8%
[
13.0%
-
13.5%
]
13.42%
3136.7%
[
14.0%
-
14.5%
]
14.20%
31732.8%
[
15.5%
-
16.0%
]
15.79%
1920.0%
[
17.0%
-
17.5%
]
17.14%
38541.5%
[
21.0%
-
21.5%
]
21.35%
8923.1%
[
34.5%
-
35.0%
]
34.52%
19768.3%
[
61.0%
-
61.5%
]
61.26%
11183.3%