Dutch West Indian 2 or more Vehicles in Household
COMPARE
Dutch West Indian
Select to Compare
2 or more Vehicles in Household
Dutch West Indian 2 or more Vehicles in Household
55.6%
2+ VEHICLES AVAILABLE
59.8/ 100
METRIC RATING
164th/ 347
METRIC RANK
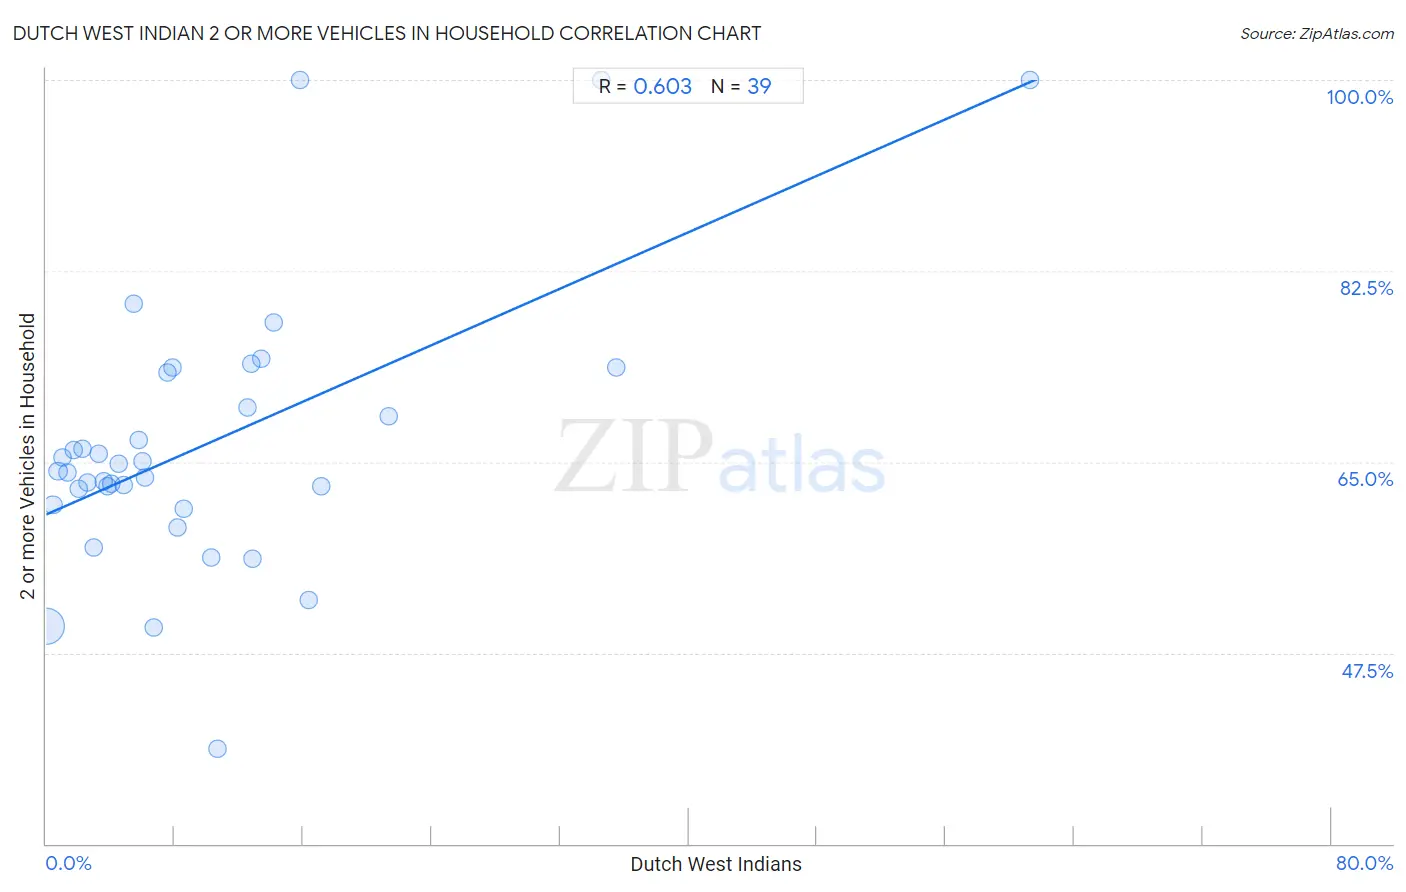
Dutch West Indian 2 or more Vehicles in Household Correlation Chart
The statistical analysis conducted on geographies consisting of 85,766,577 people shows a significant positive correlation between the proportion of Dutch West Indians and percentage of households with 2 or more vehicles available in the United States with a correlation coefficient (R) of 0.603 and weighted average of 55.6%. On average, for every 1% (one percent) increase in Dutch West Indians within a typical geography, there is an increase of 0.65% in percentage of households with 2 or more vehicles available.
It is essential to understand that the correlation between the percentage of Dutch West Indians and percentage of households with 2 or more vehicles available does not imply a direct cause-and-effect relationship. It remains uncertain whether the presence of Dutch West Indians influences an upward or downward trend in the level of percentage of households with 2 or more vehicles available within an area, or if Dutch West Indians simply ended up residing in those areas with higher or lower levels of percentage of households with 2 or more vehicles available due to other factors.
Demographics Similar to Dutch West Indians by 2 or more Vehicles in Household
In terms of 2 or more vehicles in household, the demographic groups most similar to Dutch West Indians are Immigrants from Zimbabwe (55.6%, a difference of 0.010%), Immigrants from El Salvador (55.6%, a difference of 0.020%), German Russian (55.6%, a difference of 0.040%), Colville (55.6%, a difference of 0.050%), and Immigrants from Sri Lanka (55.5%, a difference of 0.060%).
| Demographics | Rating | Rank | 2 or more Vehicles in Household |
| Immigrants from Kuwait | 70.2 /100 | #157 | Good 55.8% |
| Tlingit-Haida | 68.5 /100 | #158 | Good 55.8% |
| Paiute | 68.0 /100 | #159 | Good 55.8% |
| Crow | 67.0 /100 | #160 | Good 55.7% |
| Colville | 61.1 /100 | #161 | Good 55.6% |
| German Russians | 60.9 /100 | #162 | Good 55.6% |
| Immigrants from Zimbabwe | 60.2 /100 | #163 | Good 55.6% |
| Dutch West Indians | 59.8 /100 | #164 | Average 55.6% |
| Immigrants from El Salvador | 59.4 /100 | #165 | Average 55.6% |
| Immigrants from Sri Lanka | 58.3 /100 | #166 | Average 55.5% |
| Kenyans | 58.1 /100 | #167 | Average 55.5% |
| French American Indians | 56.7 /100 | #168 | Average 55.5% |
| Immigrants from Austria | 56.3 /100 | #169 | Average 55.5% |
| Romanians | 55.8 /100 | #170 | Average 55.5% |
| Immigrants from Costa Rica | 54.4 /100 | #171 | Average 55.4% |
Dutch West Indian 2 or more Vehicles in Household Correlation Summary
| Measurement | Dutch West Indian Data | 2 or more Vehicles in Household Data |
| Minimum | 0.033% | 38.7% |
| Maximum | 61.3% | 100.0% |
| Range | 61.2% | 61.3% |
| Mean | 10.0% | 66.6% |
| Median | 6.2% | 64.1% |
| Interquartile 25% (IQ1) | 3.0% | 61.1% |
| Interquartile 75% (IQ3) | 12.9% | 73.2% |
| Interquartile Range (IQR) | 9.9% | 12.1% |
| Standard Deviation (Sample) | 11.7% | 12.6% |
| Standard Deviation (Population) | 11.6% | 12.4% |
Correlation Details
| Dutch West Indian Percentile | Sample Size | 2 or more Vehicles in Household |
[ 0.0% - 0.5% ] 0.033% | 82,977,925 | 49.9% |
[ 0.0% - 0.5% ] 0.42% | 1,810,295 | 61.1% |
[ 0.5% - 1.0% ] 0.74% | 492,150 | 64.1% |
[ 1.0% - 1.5% ] 1.05% | 186,063 | 65.4% |
[ 1.0% - 1.5% ] 1.35% | 99,793 | 64.1% |
[ 1.5% - 2.0% ] 1.68% | 61,313 | 66.1% |
[ 2.0% - 2.5% ] 2.00% | 43,753 | 62.6% |
[ 2.0% - 2.5% ] 2.28% | 14,716 | 66.2% |
[ 2.5% - 3.0% ] 2.60% | 27,206 | 63.1% |
[ 2.5% - 3.0% ] 2.95% | 12,593 | 57.1% |
[ 3.0% - 3.5% ] 3.24% | 10,009 | 65.8% |
[ 3.5% - 4.0% ] 3.57% | 6,281 | 63.2% |
[ 3.5% - 4.0% ] 3.80% | 3,159 | 62.7% |
[ 4.0% - 4.5% ] 4.07% | 6,714 | 63.0% |
[ 4.5% - 5.0% ] 4.53% | 1,037 | 64.9% |
[ 4.5% - 5.0% ] 4.84% | 2,953 | 62.9% |
[ 5.0% - 5.5% ] 5.44% | 1,140 | 79.5% |
[ 5.5% - 6.0% ] 5.75% | 1,462 | 67.0% |
[ 5.5% - 6.0% ] 5.98% | 518 | 65.0% |
[ 6.0% - 6.5% ] 6.18% | 728 | 63.6% |
[ 6.5% - 7.0% ] 6.67% | 405 | 49.9% |
[ 7.5% - 8.0% ] 7.58% | 1,069 | 73.2% |
[ 7.5% - 8.0% ] 7.89% | 1,420 | 73.7% |
[ 8.0% - 8.5% ] 8.17% | 208 | 59.0% |
[ 8.5% - 9.0% ] 8.55% | 1,216 | 60.8% |
[ 10.0% - 10.5% ] 10.27% | 292 | 56.3% |
[ 10.5% - 11.0% ] 10.64% | 47 | 38.7% |
[ 12.0% - 12.5% ] 12.50% | 24 | 70.0% |
[ 12.5% - 13.0% ] 12.76% | 439 | 74.1% |
[ 12.5% - 13.0% ] 12.88% | 132 | 56.1% |
[ 13.0% - 13.5% ] 13.42% | 313 | 74.5% |
[ 14.0% - 14.5% ] 14.20% | 317 | 77.8% |
[ 15.5% - 16.0% ] 15.79% | 19 | 100.0% |
[ 16.0% - 16.5% ] 16.36% | 55 | 52.4% |
[ 17.0% - 17.5% ] 17.14% | 385 | 62.7% |
[ 21.0% - 21.5% ] 21.35% | 89 | 69.2% |
[ 34.5% - 35.0% ] 34.52% | 197 | 100.0% |
[ 35.0% - 35.5% ] 35.48% | 31 | 73.7% |
[ 61.0% - 61.5% ] 61.26% | 111 | 100.0% |