Dutch West Indian Wage/Income Gap

COMPARE

Dutch West Indian
Race
Ancestry
AfghanAfricanAlaska NativeAlaskan AthabascanAlbanianAleutAlsatianAmericanApacheArabArapahoArgentineanArmenianAssyrian/Chaldean/SyriacAustralianAustrianBahamianBangladeshiBarbadianBasqueBelgianBelizeanBermudanBhutaneseBlackfeetBolivianBrazilianBritishBritish West IndianBulgarianBurmeseCajunCambodianCanadianCape VerdeanCarpatho RusynCelticCentral AmericanCentral American IndianCherokeeCheyenneChickasawChileanChineseChippewaChoctawColombianColvilleComancheCosta RicanCreeCreekCroatianCrowCubanCypriotCzechCzechoslovakianDanishDelawareDominicanDutchDutch West IndianEastern EuropeanEcuadorianEgyptianEnglishEstonianEthiopianEuropeanFijianFilipinoFinnishFrenchFrench American IndianFrench CanadianGermanGerman RussianGhanaianGreekGuamanian/ChamorroGuatemalanGuyaneseHaitianHmongHonduranHopiHoumaHungarianIcelanderIndian (Asian)IndonesianInupiatIranianIraqiIrishIroquoisIsraeliItalianJamaicanJapaneseJordanianKenyanKiowaKoreanLaotianLatvianLebaneseLiberianLithuanianLumbeeLuxembourgerMacedonianMalaysianMalteseMarshalleseMenomineeMexicanMexican American IndianMongolianMoroccanNative HawaiianNavajoNepaleseNew ZealanderNicaraguanNigerianNorthern EuropeanNorwegianOkinawanOsageOttawaPaiutePakistaniPalestinianPanamanianParaguayanPennsylvania GermanPeruvianPimaPolishPortuguesePotawatomiPuebloPuerto RicanPuget Sound SalishRomanianRussianSalvadoranSamoanScandinavianScotch-IrishScottishSeminoleSenegaleseSerbianShoshoneSierra LeoneanSiouxSlavicSlovakSloveneSomaliSouth AfricanSouth AmericanSouth American IndianSoviet UnionSpaniardSpanishSpanish AmericanSpanish American IndianSri LankanSubsaharan AfricanSudaneseSwedishSwissSyrianTaiwaneseThaiTlingit-HaidaTohono O'OdhamTonganTrinidadian and TobagonianTsimshianTurkishU.S. Virgin IslanderUgandanUkrainianUruguayanUteVenezuelanVietnameseWelshWest IndianYakamaYaquiYugoslavianYumanYup'ikZimbabwean
Immigration
NonimmigrantsImmigrantsAfghanistanAfricaAlbaniaArgentinaArmeniaAsiaAustraliaAustriaBahamasBangladeshBarbadosBelarusBelgiumBelizeBoliviaBosnia and HerzegovinaBrazilBulgariaBurma/MyanmarCabo VerdeCambodiaCameroonCanadaCaribbeanCentral AmericaChileChinaColombiaCongoCosta RicaCroatiaCubaCzechoslovakiaDenmarkDominicaDominican RepublicEastern AfricaEastern AsiaEastern EuropeEcuadorEgyptEl SalvadorEnglandEritreaEthiopiaEuropeFijiFranceGermanyGhanaGreeceGrenadaGuatemalaGuyanaHaitiHondurasHong KongHungaryIndiaIndonesiaIranIraqIrelandIsraelItalyJamaicaJapanJordanKazakhstanKenyaKoreaKuwaitLaosLatin AmericaLatviaLebanonLiberiaLithuaniaMalaysiaMexicoMicronesiaMiddle AfricaMoldovaMoroccoNepalNetherlandsNicaraguaNigeriaNorth AmericaNorth MacedoniaNorthern AfricaNorthern EuropeNorwayOceaniaPakistanPanamaPeruPhilippinesPolandPortugalRomaniaRussiaSaudi ArabiaScotlandSenegalSerbiaSierra LeoneSingaporeSomaliaSouth AfricaSouth AmericaSouth Central AsiaSouth Eastern AsiaSouthern EuropeSpainSri LankaSt. Vincent and the GrenadinesSudanSwedenSwitzerlandSyriaTaiwanThailandTrinidad and TobagoTurkeyUgandaUkraineUruguayUzbekistanVenezuelaVietnamWest IndiesWestern AfricaWestern AsiaWestern EuropeYemenZaireZimbabweAzores
Select to Compare
Race
Ancestry
AfghanAfricanAlaska NativeAlaskan AthabascanAlbanianAleutAlsatianAmericanApacheArabArapahoArgentineanArmenianAssyrian/Chaldean/SyriacAustralianAustrianBahamianBangladeshiBarbadianBasqueBelgianBelizeanBermudanBhutaneseBlackfeetBolivianBrazilianBritishBritish West IndianBulgarianBurmeseCajunCambodianCanadianCape VerdeanCarpatho RusynCelticCentral AmericanCentral American IndianCherokeeCheyenneChickasawChileanChineseChippewaChoctawColombianColvilleComancheCosta RicanCreeCreekCroatianCrowCubanCypriotCzechCzechoslovakianDanishDelawareDominicanDutchEastern EuropeanEcuadorianEgyptianEnglishEstonianEthiopianEuropeanFijianFilipinoFinnishFrenchFrench American IndianFrench CanadianGermanGerman RussianGhanaianGreekGuamanian/ChamorroGuatemalanGuyaneseHaitianHmongHonduranHopiHoumaHungarianIcelanderIndian (Asian)IndonesianInupiatIranianIraqiIrishIroquoisIsraeliItalianJamaicanJapaneseJordanianKenyanKiowaKoreanLaotianLatvianLebaneseLiberianLithuanianLumbeeLuxembourgerMacedonianMalaysianMalteseMarshalleseMenomineeMexicanMexican American IndianMongolianMoroccanNative HawaiianNavajoNepaleseNew ZealanderNicaraguanNigerianNorthern EuropeanNorwegianOkinawanOsageOttawaPaiutePakistaniPalestinianPanamanianParaguayanPennsylvania GermanPeruvianPimaPolishPortuguesePotawatomiPuebloPuerto RicanPuget Sound SalishRomanianRussianSalvadoranSamoanScandinavianScotch-IrishScottishSeminoleSenegaleseSerbianShoshoneSierra LeoneanSiouxSlavicSlovakSloveneSomaliSouth AfricanSouth AmericanSouth American IndianSoviet UnionSpaniardSpanishSpanish AmericanSpanish American IndianSri LankanSubsaharan AfricanSudaneseSwedishSwissSyrianTaiwaneseThaiTlingit-HaidaTohono O'OdhamTonganTrinidadian and TobagonianTsimshianTurkishU.S. Virgin IslanderUgandanUkrainianUruguayanUteVenezuelanVietnameseWelshWest IndianYakamaYaquiYugoslavianYumanYup'ikZimbabwean
Immigration
NonimmigrantsImmigrantsAfghanistanAfricaAlbaniaArgentinaArmeniaAsiaAustraliaAustriaBahamasBangladeshBarbadosBelarusBelgiumBelizeBoliviaBosnia and HerzegovinaBrazilBulgariaBurma/MyanmarCabo VerdeCambodiaCameroonCanadaCaribbeanCentral AmericaChileChinaColombiaCongoCosta RicaCroatiaCubaCzechoslovakiaDenmarkDominicaDominican RepublicEastern AfricaEastern AsiaEastern EuropeEcuadorEgyptEl SalvadorEnglandEritreaEthiopiaEuropeFijiFranceGermanyGhanaGreeceGrenadaGuatemalaGuyanaHaitiHondurasHong KongHungaryIndiaIndonesiaIranIraqIrelandIsraelItalyJamaicaJapanJordanKazakhstanKenyaKoreaKuwaitLaosLatin AmericaLatviaLebanonLiberiaLithuaniaMalaysiaMexicoMicronesiaMiddle AfricaMoldovaMoroccoNepalNetherlandsNicaraguaNigeriaNorth AmericaNorth MacedoniaNorthern AfricaNorthern EuropeNorwayOceaniaPakistanPanamaPeruPhilippinesPolandPortugalRomaniaRussiaSaudi ArabiaScotlandSenegalSerbiaSierra LeoneSingaporeSomaliaSouth AfricaSouth AmericaSouth Central AsiaSouth Eastern AsiaSouthern EuropeSpainSri LankaSt. Vincent and the GrenadinesSudanSwedenSwitzerlandSyriaTaiwanThailandTrinidad and TobagoTurkeyUgandaUkraineUruguayUzbekistanVenezuelaVietnamWest IndiesWestern AfricaWestern AsiaWestern EuropeYemenZaireZimbabweAzores
Wage/Income Gap
Income
Poverty
Unemployment
Labor Participation
Family Structure
Vehicle Availability
Education Level
Disability

Dutch West Indian Wage/Income Gap
Fair

26.3%
WAGE/INCOME GAP
21.0/ 100
METRIC RATING
199th/ 347
METRIC RANK

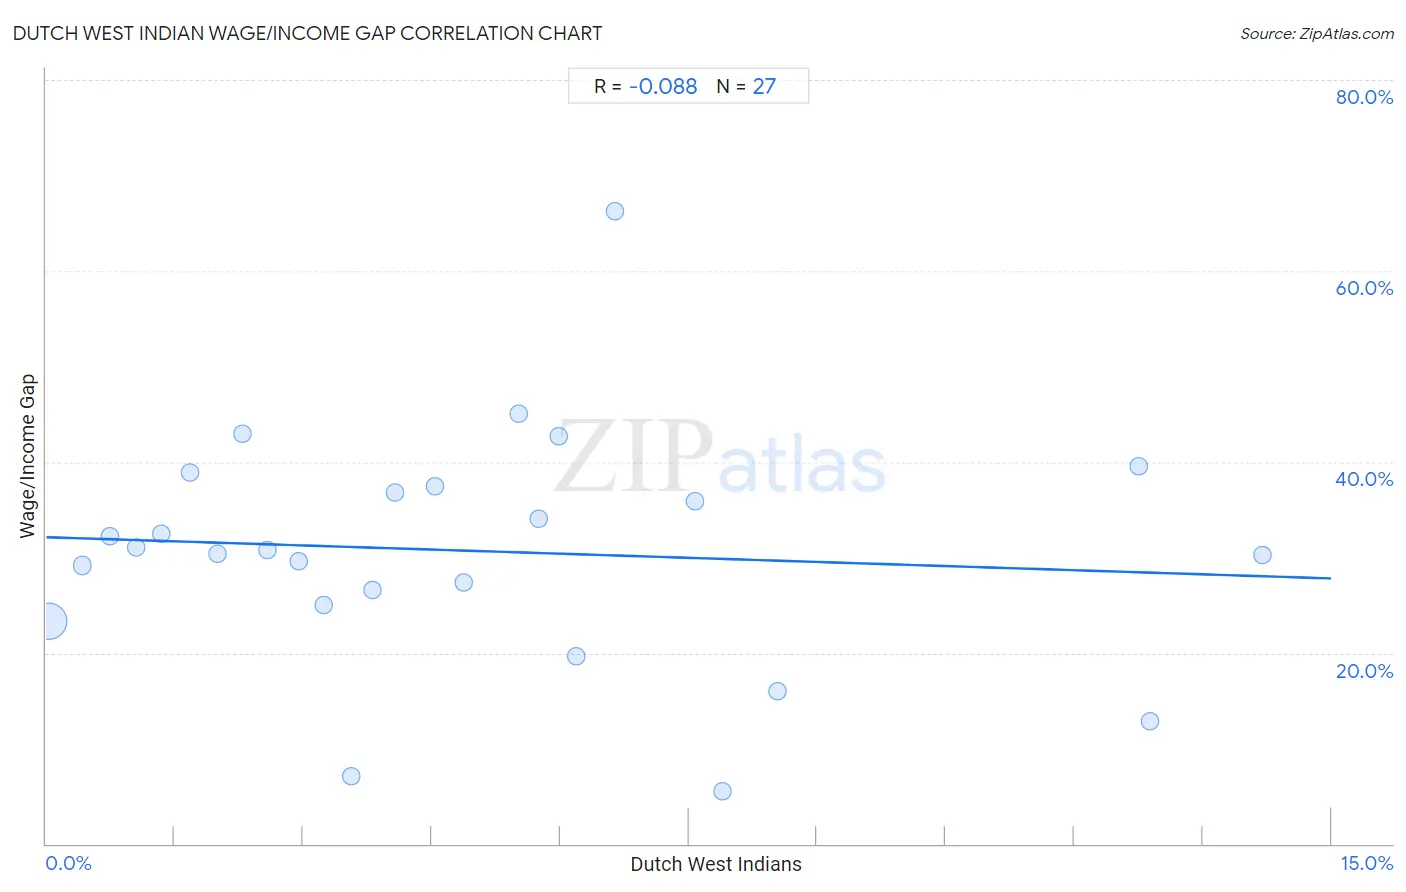
Dutch West Indian Wage/Income Gap Correlation Chart

The statistical analysis conducted on geographies consisting of 85,715,273 people shows a slight negative correlation between the proportion of Dutch West Indians and wage/income gap percentage in the United States with a correlation coefficient (R) of -0.088 and weighted average of 26.3%. On average, for every 1% (one percent) increase in Dutch West Indians within a typical geography, there is a decrease of 0.29% in wage/income gap percentage.
Dutch West Indian Wage/Income Gap
It is essential to understand that the correlation between the percentage of Dutch West Indians and wage/income gap percentage does not imply a direct cause-and-effect relationship. It remains uncertain whether the presence of Dutch West Indians influences an upward or downward trend in the level of wage/income gap percentage within an area, or if Dutch West Indians simply ended up residing in those areas with higher or lower levels of wage/income gap percentage due to other factors.

Demographics Similar to Dutch West Indians by Wage/Income Gap

In terms of wage/income gap, the demographic groups most similar to Dutch West Indians are Delaware (26.3%, a difference of 0.010%), Venezuelan (26.3%, a difference of 0.050%), Zimbabwean (26.3%, a difference of 0.060%), Immigrants from Western Asia (26.3%, a difference of 0.070%), and Immigrants from Malaysia (26.3%, a difference of 0.12%).
DemographicsRating | RankWage/Income Gap
Immigrants from Bulgaria
22.5
/100
|
#192
Fair
26.3%
Immigrants from Jordan
22.4
/100
|
#193
Fair
26.3%
Chileans
22.3
/100
|
#194
Fair
26.3%
Immigrants from Malaysia
22.2
/100
|
#195
Fair
26.3%
Immigrants from Western Asia
21.7
/100
|
#196
Fair
26.3%
Zimbabweans
21.6
/100
|
#197
Fair
26.3%
Venezuelans
21.5
/100
|
#198
Fair
26.3%
Dutch West Indians
21.0
/100
|
#199
Fair
26.3%
Delaware
20.9
/100
|
#200
Fair
26.3%
Immigrants from Syria
19.3
/100
|
#201
Poor
26.4%
Laotians
19.2
/100
|
#202
Poor
26.4%
Immigrants from Eastern Europe
19.2
/100
|
#203
Poor
26.4%
Immigrants from Russia
19.0
/100
|
#204
Poor
26.4%
Immigrants from Southern Europe
17.3
/100
|
#205
Poor
26.4%
Indians (Asian)
16.5
/100
|
#206
Poor
26.4%

Dutch West Indian Wage/Income Gap Correlation Summary

MeasurementDutch West Indian DataWage/Income Gap Data
Minimum0.033%5.5%
Maximum14.2%66.2%
Range14.2%60.8%
Mean4.9%30.7%
Median4.1%30.7%
Interquartile 25% (IQ1)2.0%25.1%
Interquartile 75% (IQ3)6.6%37.4%
Interquartile Range (IQR)4.6%12.3%
Standard Deviation (Sample)3.8%12.4%
Standard Deviation (Population)3.7%12.2%

Correlation Details

Dutch West Indian PercentileSample SizeWage/Income Gap
[
0.0%
-
0.5%
]
0.033%
82,970,41923.3%
[
0.0%
-
0.5%
]
0.42%
1,798,23629.2%
[
0.5%
-
1.0%
]
0.74%
477,54032.3%
[
1.0%
-
1.5%
]
1.05%
185,63731.0%
[
1.0%
-
1.5%
]
1.35%
98,99732.5%
[
1.5%
-
2.0%
]
1.68%
58,77138.9%
[
1.5%
-
2.0%
]
1.99%
39,15130.4%
[
2.0%
-
2.5%
]
2.29%
13,59442.9%
[
2.5%
-
3.0%
]
2.59%
25,75130.7%
[
2.5%
-
3.0%
]
2.95%
12,59329.6%
[
3.0%
-
3.5%
]
3.24%
10,00925.1%
[
3.5%
-
4.0%
]
3.57%
6,2817.0%
[
3.5%
-
4.0%
]
3.81%
2,72826.6%
[
4.0%
-
4.5%
]
4.07%
6,49236.7%
[
4.5%
-
5.0%
]
4.53%
1,03737.4%
[
4.5%
-
5.0%
]
4.88%
1,21027.4%
[
5.5%
-
6.0%
]
5.51%
25445.1%
[
5.5%
-
6.0%
]
5.75%
1,46234.1%
[
5.5%
-
6.0%
]
5.99%
50142.7%
[
6.0%
-
6.5%
]
6.18%
72819.6%
[
6.5%
-
7.0%
]
6.64%
24166.2%
[
7.5%
-
8.0%
]
7.58%
1,06935.9%
[
7.5%
-
8.0%
]
7.89%
1,3565.5%
[
8.5%
-
9.0%
]
8.54%
32815.9%
[
12.5%
-
13.0%
]
12.76%
43939.6%
[
12.5%
-
13.0%
]
12.88%
13212.8%
[
14.0%
-
14.5%
]
14.20%
31730.3%