Colombian 4 or more Vehicles in Household
COMPARE
Colombian
Select to Compare
4 or more Vehicles in Household
Colombian 4 or more Vehicles in Household
5.5%
4+ VEHICLES AVAILABLE
0.7/ 100
METRIC RATING
268th/ 347
METRIC RANK
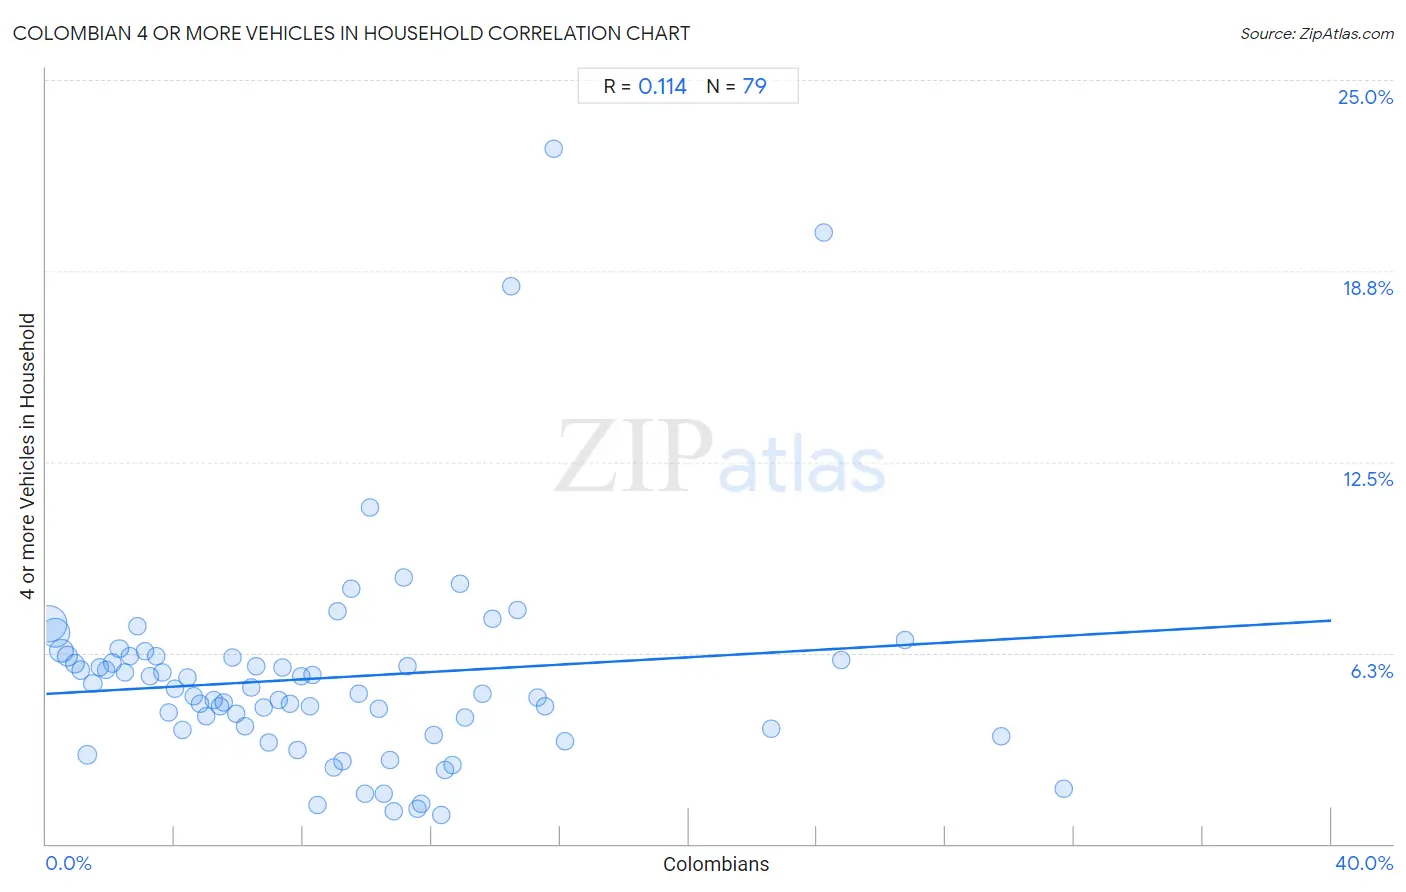
Colombian 4 or more Vehicles in Household Correlation Chart
The statistical analysis conducted on geographies consisting of 417,475,728 people shows a poor positive correlation between the proportion of Colombians and percentage of households with 4 or more vehicles available in the United States with a correlation coefficient (R) of 0.114 and weighted average of 5.5%. On average, for every 1% (one percent) increase in Colombians within a typical geography, there is an increase of 0.060% in percentage of households with 4 or more vehicles available.
It is essential to understand that the correlation between the percentage of Colombians and percentage of households with 4 or more vehicles available does not imply a direct cause-and-effect relationship. It remains uncertain whether the presence of Colombians influences an upward or downward trend in the level of percentage of households with 4 or more vehicles available within an area, or if Colombians simply ended up residing in those areas with higher or lower levels of percentage of households with 4 or more vehicles available due to other factors.
Demographics Similar to Colombians by 4 or more Vehicles in Household
In terms of 4 or more vehicles in household, the demographic groups most similar to Colombians are Carpatho Rusyn (5.5%, a difference of 0.16%), Okinawan (5.5%, a difference of 0.36%), Immigrants from Ukraine (5.6%, a difference of 0.43%), Immigrants from Sudan (5.5%, a difference of 0.46%), and Immigrants from Nepal (5.6%, a difference of 0.51%).
| Demographics | Rating | Rank | 4 or more Vehicles in Household |
| Sudanese | 1.2 /100 | #261 | Tragic 5.6% |
| Bermudans | 1.2 /100 | #262 | Tragic 5.6% |
| Immigrants from Saudi Arabia | 1.1 /100 | #263 | Tragic 5.6% |
| Immigrants from Africa | 1.0 /100 | #264 | Tragic 5.6% |
| South Americans | 0.9 /100 | #265 | Tragic 5.6% |
| Immigrants from Nepal | 0.9 /100 | #266 | Tragic 5.6% |
| Immigrants from Ukraine | 0.9 /100 | #267 | Tragic 5.6% |
| Colombians | 0.7 /100 | #268 | Tragic 5.5% |
| Carpatho Rusyns | 0.7 /100 | #269 | Tragic 5.5% |
| Okinawans | 0.6 /100 | #270 | Tragic 5.5% |
| Immigrants from Sudan | 0.6 /100 | #271 | Tragic 5.5% |
| Immigrants from Kazakhstan | 0.6 /100 | #272 | Tragic 5.5% |
| Macedonians | 0.6 /100 | #273 | Tragic 5.5% |
| Blacks/African Americans | 0.6 /100 | #274 | Tragic 5.5% |
| Cambodians | 0.5 /100 | #275 | Tragic 5.5% |
Colombian 4 or more Vehicles in Household Correlation Summary
| Measurement | Colombian Data | 4 or more Vehicles in Household Data |
| Minimum | 0.096% | 0.92% |
| Maximum | 31.7% | 22.8% |
| Range | 31.6% | 21.8% |
| Mean | 8.8% | 5.4% |
| Median | 7.8% | 4.9% |
| Interquartile 25% (IQ1) | 3.8% | 3.7% |
| Interquartile 75% (IQ3) | 12.1% | 6.1% |
| Interquartile Range (IQR) | 8.3% | 2.4% |
| Standard Deviation (Sample) | 6.8% | 3.6% |
| Standard Deviation (Population) | 6.7% | 3.5% |
Correlation Details
| Colombian Percentile | Sample Size | 4 or more Vehicles in Household |
[ 0.0% - 0.5% ] 0.096% | 170,176,241 | 7.2% |
[ 0.0% - 0.5% ] 0.28% | 97,116,400 | 6.9% |
[ 0.0% - 0.5% ] 0.47% | 53,185,155 | 6.3% |
[ 0.5% - 1.0% ] 0.67% | 24,352,480 | 6.1% |
[ 0.5% - 1.0% ] 0.88% | 13,128,859 | 5.9% |
[ 1.0% - 1.5% ] 1.07% | 8,342,668 | 5.7% |
[ 1.0% - 1.5% ] 1.27% | 15,058,688 | 2.9% |
[ 1.0% - 1.5% ] 1.46% | 5,903,218 | 5.2% |
[ 1.5% - 2.0% ] 1.66% | 3,951,412 | 5.8% |
[ 1.5% - 2.0% ] 1.85% | 2,454,135 | 5.7% |
[ 2.0% - 2.5% ] 2.06% | 2,466,246 | 5.9% |
[ 2.0% - 2.5% ] 2.27% | 1,685,062 | 6.4% |
[ 2.0% - 2.5% ] 2.46% | 1,710,245 | 5.6% |
[ 2.5% - 3.0% ] 2.62% | 1,771,368 | 6.2% |
[ 2.5% - 3.0% ] 2.83% | 1,145,520 | 7.1% |
[ 3.0% - 3.5% ] 3.07% | 1,374,443 | 6.3% |
[ 3.0% - 3.5% ] 3.25% | 658,752 | 5.5% |
[ 3.0% - 3.5% ] 3.42% | 924,261 | 6.1% |
[ 3.5% - 4.0% ] 3.63% | 1,009,507 | 5.6% |
[ 3.5% - 4.0% ] 3.81% | 759,698 | 4.3% |
[ 3.5% - 4.0% ] 4.00% | 713,117 | 5.1% |
[ 4.0% - 4.5% ] 4.24% | 1,249,112 | 3.7% |
[ 4.0% - 4.5% ] 4.40% | 639,472 | 5.4% |
[ 4.5% - 5.0% ] 4.58% | 583,291 | 4.8% |
[ 4.5% - 5.0% ] 4.78% | 425,066 | 4.6% |
[ 4.5% - 5.0% ] 4.99% | 419,340 | 4.2% |
[ 5.0% - 5.5% ] 5.20% | 512,483 | 4.7% |
[ 5.0% - 5.5% ] 5.40% | 429,910 | 4.5% |
[ 5.5% - 6.0% ] 5.54% | 328,753 | 4.6% |
[ 5.5% - 6.0% ] 5.79% | 312,321 | 6.1% |
[ 5.5% - 6.0% ] 5.91% | 86,762 | 4.2% |
[ 6.0% - 6.5% ] 6.18% | 396,251 | 3.9% |
[ 6.0% - 6.5% ] 6.38% | 495,903 | 5.1% |
[ 6.5% - 7.0% ] 6.54% | 371,933 | 5.8% |
[ 6.5% - 7.0% ] 6.76% | 337,069 | 4.5% |
[ 6.5% - 7.0% ] 6.94% | 182,201 | 3.3% |
[ 7.0% - 7.5% ] 7.23% | 88,611 | 4.7% |
[ 7.0% - 7.5% ] 7.35% | 446,145 | 5.8% |
[ 7.5% - 8.0% ] 7.58% | 77,985 | 4.6% |
[ 7.5% - 8.0% ] 7.80% | 78,531 | 3.1% |
[ 7.5% - 8.0% ] 7.94% | 140,425 | 5.5% |
[ 8.0% - 8.5% ] 8.21% | 135,918 | 4.5% |
[ 8.0% - 8.5% ] 8.27% | 71,553 | 5.5% |
[ 8.0% - 8.5% ] 8.45% | 57,507 | 1.3% |
[ 8.5% - 9.0% ] 8.95% | 135,455 | 2.5% |
[ 9.0% - 9.5% ] 9.05% | 55,872 | 7.6% |
[ 9.0% - 9.5% ] 9.23% | 53,431 | 2.7% |
[ 9.5% - 10.0% ] 9.50% | 11,577 | 8.3% |
[ 9.5% - 10.0% ] 9.74% | 113,784 | 4.9% |
[ 9.5% - 10.0% ] 9.94% | 32,881 | 1.7% |
[ 10.0% - 10.5% ] 10.06% | 75,659 | 11.0% |
[ 10.0% - 10.5% ] 10.36% | 167,404 | 4.4% |
[ 10.0% - 10.5% ] 10.49% | 67,818 | 1.6% |
[ 10.5% - 11.0% ] 10.70% | 121,169 | 2.7% |
[ 10.5% - 11.0% ] 10.81% | 74,601 | 1.1% |
[ 11.0% - 11.5% ] 11.13% | 593 | 8.7% |
[ 11.0% - 11.5% ] 11.23% | 69,599 | 5.8% |
[ 11.5% - 12.0% ] 11.55% | 42,940 | 1.1% |
[ 11.5% - 12.0% ] 11.68% | 8,024 | 1.3% |
[ 12.0% - 12.5% ] 12.07% | 149,116 | 3.6% |
[ 12.0% - 12.5% ] 12.30% | 45,357 | 0.92% |
[ 12.0% - 12.5% ] 12.43% | 118,135 | 2.4% |
[ 12.5% - 13.0% ] 12.65% | 50,975 | 2.6% |
[ 12.5% - 13.0% ] 12.87% | 119,388 | 8.5% |
[ 13.0% - 13.5% ] 13.05% | 21,715 | 4.1% |
[ 13.5% - 14.0% ] 13.58% | 31,514 | 4.9% |
[ 13.5% - 14.0% ] 13.88% | 26,548 | 7.4% |
[ 14.0% - 14.5% ] 14.48% | 359 | 18.3% |
[ 14.5% - 15.0% ] 14.68% | 42,427 | 7.7% |
[ 15.0% - 15.5% ] 15.31% | 18,601 | 4.8% |
[ 15.5% - 16.0% ] 15.53% | 42,678 | 4.5% |
[ 15.5% - 16.0% ] 15.80% | 1,829 | 22.8% |
[ 16.0% - 16.5% ] 16.14% | 11,069 | 3.4% |
[ 22.5% - 23.0% ] 22.56% | 133 | 3.8% |
[ 24.0% - 24.5% ] 24.19% | 186 | 20.0% |
[ 24.5% - 25.0% ] 24.77% | 6,186 | 6.0% |
[ 26.5% - 27.0% ] 26.72% | 116 | 6.7% |
[ 29.5% - 30.0% ] 29.74% | 2,811 | 3.5% |
[ 31.5% - 32.0% ] 31.69% | 1,761 | 1.8% |