Colombian Male Disability
COMPARE
Colombian
Select to Compare
Male Disability
Colombian Male Disability
10.5%
DISABILITY | MALES
99.2/ 100
METRIC RATING
68th/ 347
METRIC RANK
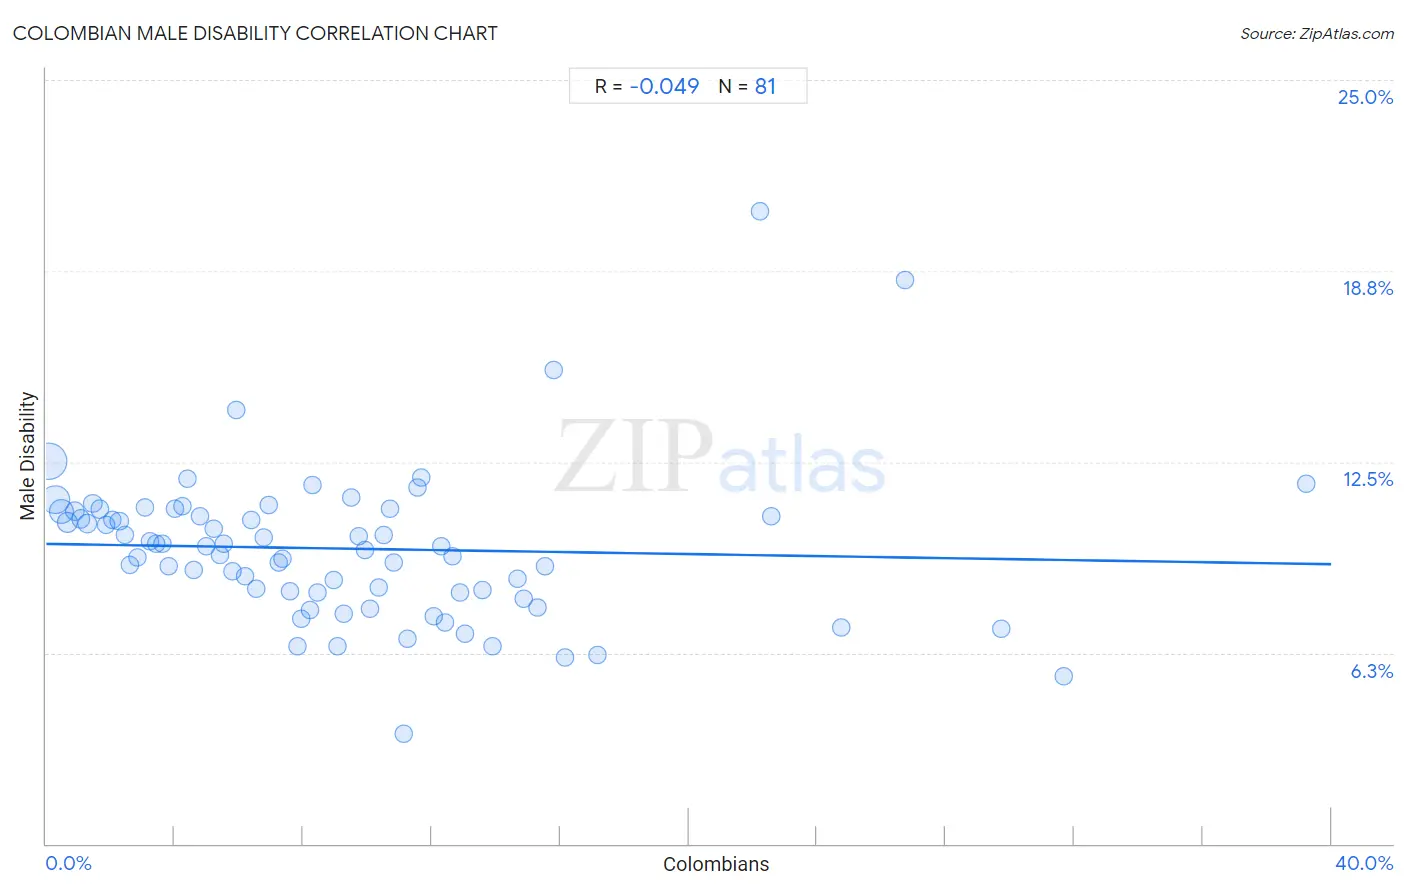
Colombian Male Disability Correlation Chart
The statistical analysis conducted on geographies consisting of 419,578,648 people shows no correlation between the proportion of Colombians and percentage of males with a disability in the United States with a correlation coefficient (R) of -0.049 and weighted average of 10.5%. On average, for every 1% (one percent) increase in Colombians within a typical geography, there is a decrease of 0.017% in percentage of males with a disability.
It is essential to understand that the correlation between the percentage of Colombians and percentage of males with a disability does not imply a direct cause-and-effect relationship. It remains uncertain whether the presence of Colombians influences an upward or downward trend in the level of percentage of males with a disability within an area, or if Colombians simply ended up residing in those areas with higher or lower levels of percentage of males with a disability due to other factors.
Demographics Similar to Colombians by Male Disability
In terms of male disability, the demographic groups most similar to Colombians are Ecuadorian (10.5%, a difference of 0.0%), Guyanese (10.5%, a difference of 0.10%), Immigrants from Afghanistan (10.5%, a difference of 0.10%), Immigrants from Grenada (10.5%, a difference of 0.11%), and Jordanian (10.5%, a difference of 0.13%).
| Demographics | Rating | Rank | Male Disability |
| Immigrants from Northern Africa | 99.4 /100 | #61 | Exceptional 10.4% |
| Immigrants from Ecuador | 99.3 /100 | #62 | Exceptional 10.4% |
| Immigrants from Belarus | 99.3 /100 | #63 | Exceptional 10.4% |
| Jordanians | 99.3 /100 | #64 | Exceptional 10.5% |
| Immigrants from Grenada | 99.2 /100 | #65 | Exceptional 10.5% |
| Guyanese | 99.2 /100 | #66 | Exceptional 10.5% |
| Immigrants from Afghanistan | 99.2 /100 | #67 | Exceptional 10.5% |
| Colombians | 99.2 /100 | #68 | Exceptional 10.5% |
| Ecuadorians | 99.2 /100 | #69 | Exceptional 10.5% |
| Immigrants from Bulgaria | 99.1 /100 | #70 | Exceptional 10.5% |
| Immigrants from Cameroon | 99.0 /100 | #71 | Exceptional 10.5% |
| Immigrants from Serbia | 99.0 /100 | #72 | Exceptional 10.5% |
| Immigrants from Lithuania | 98.9 /100 | #73 | Exceptional 10.5% |
| Immigrants from Lebanon | 98.8 /100 | #74 | Exceptional 10.5% |
| Sierra Leoneans | 98.7 /100 | #75 | Exceptional 10.5% |
Colombian Male Disability Correlation Summary
| Measurement | Colombian Data | Male Disability Data |
| Minimum | 0.096% | 3.6% |
| Maximum | 39.2% | 20.7% |
| Range | 39.1% | 17.1% |
| Mean | 9.3% | 9.7% |
| Median | 7.9% | 9.7% |
| Interquartile 25% (IQ1) | 3.9% | 8.2% |
| Interquartile 75% (IQ3) | 12.4% | 10.9% |
| Interquartile Range (IQR) | 8.5% | 2.7% |
| Standard Deviation (Sample) | 7.5% | 2.5% |
| Standard Deviation (Population) | 7.4% | 2.5% |
Correlation Details
| Colombian Percentile | Sample Size | Male Disability |
[ 0.0% - 0.5% ] 0.096% | 170,471,089 | 12.5% |
[ 0.0% - 0.5% ] 0.28% | 97,617,691 | 11.3% |
[ 0.0% - 0.5% ] 0.47% | 53,399,600 | 10.9% |
[ 0.5% - 1.0% ] 0.67% | 24,465,788 | 10.5% |
[ 0.5% - 1.0% ] 0.88% | 13,424,311 | 10.9% |
[ 1.0% - 1.5% ] 1.07% | 8,600,012 | 10.6% |
[ 1.0% - 1.5% ] 1.27% | 15,201,301 | 10.5% |
[ 1.0% - 1.5% ] 1.46% | 5,917,314 | 11.1% |
[ 1.5% - 2.0% ] 1.66% | 3,982,507 | 11.0% |
[ 1.5% - 2.0% ] 1.85% | 2,531,100 | 10.5% |
[ 2.0% - 2.5% ] 2.06% | 2,469,001 | 10.6% |
[ 2.0% - 2.5% ] 2.27% | 1,703,070 | 10.6% |
[ 2.0% - 2.5% ] 2.46% | 1,715,202 | 10.1% |
[ 2.5% - 3.0% ] 2.62% | 1,773,508 | 9.1% |
[ 2.5% - 3.0% ] 2.83% | 1,142,719 | 9.4% |
[ 3.0% - 3.5% ] 3.07% | 1,397,308 | 11.0% |
[ 3.0% - 3.5% ] 3.25% | 658,752 | 9.9% |
[ 3.0% - 3.5% ] 3.42% | 926,510 | 9.8% |
[ 3.5% - 4.0% ] 3.63% | 1,012,035 | 9.8% |
[ 3.5% - 4.0% ] 3.81% | 762,416 | 9.1% |
[ 3.5% - 4.0% ] 4.00% | 714,036 | 11.0% |
[ 4.0% - 4.5% ] 4.24% | 1,249,112 | 11.1% |
[ 4.0% - 4.5% ] 4.40% | 639,472 | 12.0% |
[ 4.5% - 5.0% ] 4.58% | 585,478 | 9.0% |
[ 4.5% - 5.0% ] 4.78% | 425,272 | 10.7% |
[ 4.5% - 5.0% ] 4.99% | 420,845 | 9.7% |
[ 5.0% - 5.5% ] 5.20% | 545,688 | 10.3% |
[ 5.0% - 5.5% ] 5.40% | 431,367 | 9.5% |
[ 5.5% - 6.0% ] 5.54% | 328,844 | 9.8% |
[ 5.5% - 6.0% ] 5.79% | 319,482 | 8.9% |
[ 5.5% - 6.0% ] 5.91% | 86,762 | 14.2% |
[ 6.0% - 6.5% ] 6.18% | 396,251 | 8.8% |
[ 6.0% - 6.5% ] 6.38% | 496,058 | 10.6% |
[ 6.5% - 7.0% ] 6.54% | 378,044 | 8.4% |
[ 6.5% - 7.0% ] 6.76% | 337,625 | 10.0% |
[ 6.5% - 7.0% ] 6.94% | 182,201 | 11.1% |
[ 7.0% - 7.5% ] 7.23% | 88,611 | 9.2% |
[ 7.0% - 7.5% ] 7.35% | 446,829 | 9.3% |
[ 7.5% - 8.0% ] 7.58% | 77,985 | 8.3% |
[ 7.5% - 8.0% ] 7.80% | 78,531 | 6.5% |
[ 7.5% - 8.0% ] 7.94% | 140,425 | 7.4% |
[ 8.0% - 8.5% ] 8.21% | 137,791 | 7.6% |
[ 8.0% - 8.5% ] 8.27% | 72,409 | 11.7% |
[ 8.0% - 8.5% ] 8.46% | 61,991 | 8.2% |
[ 8.5% - 9.0% ] 8.95% | 135,455 | 8.6% |
[ 9.0% - 9.5% ] 9.05% | 56,025 | 6.5% |
[ 9.0% - 9.5% ] 9.26% | 75,971 | 7.5% |
[ 9.5% - 10.0% ] 9.50% | 11,577 | 11.4% |
[ 9.5% - 10.0% ] 9.73% | 130,920 | 10.1% |
[ 9.5% - 10.0% ] 9.94% | 32,881 | 9.6% |
[ 10.0% - 10.5% ] 10.06% | 75,659 | 7.7% |
[ 10.0% - 10.5% ] 10.36% | 167,404 | 8.4% |
[ 10.0% - 10.5% ] 10.49% | 67,818 | 10.1% |
[ 10.5% - 11.0% ] 10.70% | 121,169 | 11.0% |
[ 10.5% - 11.0% ] 10.81% | 74,601 | 9.2% |
[ 11.0% - 11.5% ] 11.13% | 593 | 3.6% |
[ 11.0% - 11.5% ] 11.23% | 69,599 | 6.7% |
[ 11.5% - 12.0% ] 11.55% | 42,940 | 11.7% |
[ 11.5% - 12.0% ] 11.68% | 8,024 | 12.0% |
[ 12.0% - 12.5% ] 12.07% | 149,116 | 7.4% |
[ 12.0% - 12.5% ] 12.29% | 46,195 | 9.8% |
[ 12.0% - 12.5% ] 12.43% | 118,135 | 7.2% |
[ 12.5% - 13.0% ] 12.65% | 50,975 | 9.4% |
[ 12.5% - 13.0% ] 12.87% | 119,388 | 8.2% |
[ 13.0% - 13.5% ] 13.05% | 21,715 | 6.9% |
[ 13.5% - 14.0% ] 13.58% | 31,514 | 8.3% |
[ 13.5% - 14.0% ] 13.88% | 26,548 | 6.5% |
[ 14.5% - 15.0% ] 14.68% | 42,427 | 8.7% |
[ 14.5% - 15.0% ] 14.86% | 498 | 8.0% |
[ 15.0% - 15.5% ] 15.31% | 18,601 | 7.7% |
[ 15.5% - 16.0% ] 15.53% | 45,191 | 9.1% |
[ 15.5% - 16.0% ] 15.80% | 1,829 | 15.5% |
[ 16.0% - 16.5% ] 16.14% | 11,069 | 6.1% |
[ 17.0% - 17.5% ] 17.15% | 1,026 | 6.2% |
[ 22.0% - 22.5% ] 22.22% | 180 | 20.7% |
[ 22.5% - 23.0% ] 22.56% | 133 | 10.7% |
[ 24.5% - 25.0% ] 24.77% | 6,186 | 7.1% |
[ 26.5% - 27.0% ] 26.72% | 116 | 18.5% |
[ 29.5% - 30.0% ] 29.74% | 2,811 | 7.0% |
[ 31.5% - 32.0% ] 31.69% | 1,761 | 5.5% |
[ 39.0% - 39.5% ] 39.22% | 255 | 11.8% |