Colombian Self-Care Disability
COMPARE
Colombian
Select to Compare
Self-Care Disability
Colombian Self-Care Disability
2.4%
SELF-CARE DISABILITY
89.7/ 100
METRIC RATING
127th/ 347
METRIC RANK
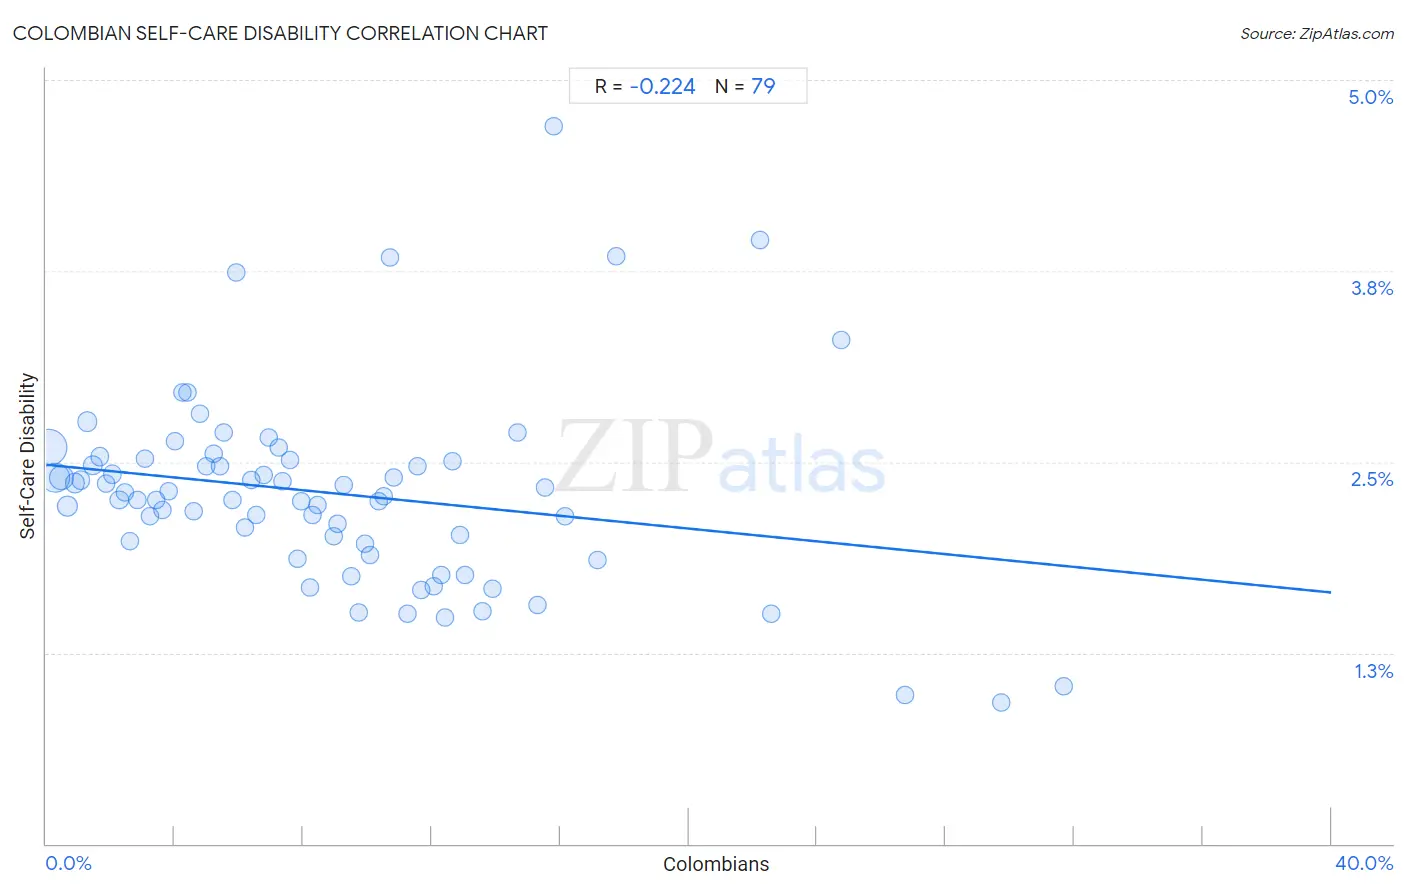
Colombian Self-Care Disability Correlation Chart
The statistical analysis conducted on geographies consisting of 419,041,543 people shows a weak negative correlation between the proportion of Colombians and percentage of population with self-care disability in the United States with a correlation coefficient (R) of -0.224 and weighted average of 2.4%. On average, for every 1% (one percent) increase in Colombians within a typical geography, there is a decrease of 0.021% in percentage of population with self-care disability.
It is essential to understand that the correlation between the percentage of Colombians and percentage of population with self-care disability does not imply a direct cause-and-effect relationship. It remains uncertain whether the presence of Colombians influences an upward or downward trend in the level of percentage of population with self-care disability within an area, or if Colombians simply ended up residing in those areas with higher or lower levels of percentage of population with self-care disability due to other factors.
Demographics Similar to Colombians by Self-Care Disability
In terms of self-care disability, the demographic groups most similar to Colombians are Immigrants from Hungary (2.4%, a difference of 0.010%), Hmong (2.4%, a difference of 0.030%), Immigrants from Romania (2.4%, a difference of 0.060%), Immigrants from Morocco (2.4%, a difference of 0.070%), and Immigrants from North America (2.4%, a difference of 0.070%).
| Demographics | Rating | Rank | Self-Care Disability |
| Uruguayans | 91.5 /100 | #120 | Exceptional 2.4% |
| Peruvians | 91.3 /100 | #121 | Exceptional 2.4% |
| Belgians | 90.9 /100 | #122 | Exceptional 2.4% |
| Immigrants from Nigeria | 90.3 /100 | #123 | Exceptional 2.4% |
| Immigrants from Morocco | 90.2 /100 | #124 | Exceptional 2.4% |
| Immigrants from North America | 90.2 /100 | #124 | Exceptional 2.4% |
| Hmong | 89.9 /100 | #126 | Excellent 2.4% |
| Colombians | 89.7 /100 | #127 | Excellent 2.4% |
| Immigrants from Hungary | 89.6 /100 | #128 | Excellent 2.4% |
| Immigrants from Romania | 89.3 /100 | #129 | Excellent 2.4% |
| Immigrants from Austria | 89.0 /100 | #130 | Excellent 2.4% |
| Poles | 88.9 /100 | #131 | Excellent 2.4% |
| Immigrants from South America | 88.8 /100 | #132 | Excellent 2.4% |
| Immigrants from Colombia | 88.5 /100 | #133 | Excellent 2.4% |
| Russians | 88.2 /100 | #134 | Excellent 2.4% |
Colombian Self-Care Disability Correlation Summary
| Measurement | Colombian Data | Self-Care Disability Data |
| Minimum | 0.096% | 0.93% |
| Maximum | 31.7% | 4.7% |
| Range | 31.6% | 3.8% |
| Mean | 8.9% | 2.3% |
| Median | 7.8% | 2.3% |
| Interquartile 25% (IQ1) | 3.8% | 2.0% |
| Interquartile 75% (IQ3) | 12.3% | 2.5% |
| Interquartile Range (IQR) | 8.5% | 0.55% |
| Standard Deviation (Sample) | 6.8% | 0.63% |
| Standard Deviation (Population) | 6.8% | 0.63% |
Correlation Details
| Colombian Percentile | Sample Size | Self-Care Disability |
[ 0.0% - 0.5% ] 0.096% | 170,368,914 | 2.6% |
[ 0.0% - 0.5% ] 0.28% | 97,495,490 | 2.4% |
[ 0.0% - 0.5% ] 0.47% | 53,333,374 | 2.4% |
[ 0.5% - 1.0% ] 0.67% | 24,414,226 | 2.2% |
[ 0.5% - 1.0% ] 0.88% | 13,389,735 | 2.4% |
[ 1.0% - 1.5% ] 1.07% | 8,546,124 | 2.4% |
[ 1.0% - 1.5% ] 1.27% | 15,187,536 | 2.8% |
[ 1.0% - 1.5% ] 1.46% | 5,895,088 | 2.5% |
[ 1.5% - 2.0% ] 1.66% | 3,973,639 | 2.5% |
[ 1.5% - 2.0% ] 1.85% | 2,520,436 | 2.4% |
[ 2.0% - 2.5% ] 2.06% | 2,467,335 | 2.4% |
[ 2.0% - 2.5% ] 2.27% | 1,689,581 | 2.3% |
[ 2.0% - 2.5% ] 2.46% | 1,709,598 | 2.3% |
[ 2.5% - 3.0% ] 2.62% | 1,771,368 | 2.0% |
[ 2.5% - 3.0% ] 2.83% | 1,141,570 | 2.3% |
[ 3.0% - 3.5% ] 3.07% | 1,396,446 | 2.5% |
[ 3.0% - 3.5% ] 3.25% | 658,752 | 2.1% |
[ 3.0% - 3.5% ] 3.42% | 917,513 | 2.2% |
[ 3.5% - 4.0% ] 3.63% | 1,011,625 | 2.2% |
[ 3.5% - 4.0% ] 3.81% | 762,416 | 2.3% |
[ 3.5% - 4.0% ] 4.00% | 713,734 | 2.6% |
[ 4.0% - 4.5% ] 4.24% | 1,249,112 | 3.0% |
[ 4.0% - 4.5% ] 4.40% | 638,960 | 3.0% |
[ 4.5% - 5.0% ] 4.58% | 582,088 | 2.2% |
[ 4.5% - 5.0% ] 4.78% | 425,272 | 2.8% |
[ 4.5% - 5.0% ] 4.99% | 419,537 | 2.5% |
[ 5.0% - 5.5% ] 5.20% | 545,688 | 2.6% |
[ 5.0% - 5.5% ] 5.40% | 429,910 | 2.5% |
[ 5.5% - 6.0% ] 5.54% | 328,824 | 2.7% |
[ 5.5% - 6.0% ] 5.79% | 316,764 | 2.3% |
[ 5.5% - 6.0% ] 5.91% | 86,762 | 3.7% |
[ 6.0% - 6.5% ] 6.18% | 395,464 | 2.1% |
[ 6.0% - 6.5% ] 6.38% | 496,058 | 2.4% |
[ 6.5% - 7.0% ] 6.54% | 378,044 | 2.2% |
[ 6.5% - 7.0% ] 6.76% | 337,069 | 2.4% |
[ 6.5% - 7.0% ] 6.94% | 181,653 | 2.7% |
[ 7.0% - 7.5% ] 7.23% | 88,611 | 2.6% |
[ 7.0% - 7.5% ] 7.35% | 446,829 | 2.4% |
[ 7.5% - 8.0% ] 7.58% | 77,985 | 2.5% |
[ 7.5% - 8.0% ] 7.80% | 78,531 | 1.9% |
[ 7.5% - 8.0% ] 7.94% | 140,425 | 2.2% |
[ 8.0% - 8.5% ] 8.21% | 135,918 | 1.7% |
[ 8.0% - 8.5% ] 8.27% | 71,868 | 2.2% |
[ 8.0% - 8.5% ] 8.46% | 61,944 | 2.2% |
[ 8.5% - 9.0% ] 8.95% | 135,455 | 2.0% |
[ 9.0% - 9.5% ] 9.05% | 55,872 | 2.1% |
[ 9.0% - 9.5% ] 9.26% | 75,971 | 2.4% |
[ 9.5% - 10.0% ] 9.50% | 11,240 | 1.8% |
[ 9.5% - 10.0% ] 9.73% | 130,920 | 1.5% |
[ 9.5% - 10.0% ] 9.94% | 32,881 | 2.0% |
[ 10.0% - 10.5% ] 10.06% | 75,659 | 1.9% |
[ 10.0% - 10.5% ] 10.36% | 166,796 | 2.2% |
[ 10.0% - 10.5% ] 10.49% | 67,818 | 2.3% |
[ 10.5% - 11.0% ] 10.70% | 121,169 | 3.8% |
[ 10.5% - 11.0% ] 10.81% | 74,601 | 2.4% |
[ 11.0% - 11.5% ] 11.23% | 69,599 | 1.5% |
[ 11.5% - 12.0% ] 11.55% | 42,940 | 2.5% |
[ 11.5% - 12.0% ] 11.68% | 8,024 | 1.7% |
[ 12.0% - 12.5% ] 12.07% | 148,452 | 1.7% |
[ 12.0% - 12.5% ] 12.29% | 46,195 | 1.8% |
[ 12.0% - 12.5% ] 12.43% | 118,135 | 1.5% |
[ 12.5% - 13.0% ] 12.65% | 50,975 | 2.5% |
[ 12.5% - 13.0% ] 12.87% | 119,388 | 2.0% |
[ 13.0% - 13.5% ] 13.05% | 21,715 | 1.8% |
[ 13.5% - 14.0% ] 13.58% | 31,514 | 1.5% |
[ 13.5% - 14.0% ] 13.88% | 26,548 | 1.7% |
[ 14.5% - 15.0% ] 14.68% | 42,427 | 2.7% |
[ 15.0% - 15.5% ] 15.31% | 18,601 | 1.6% |
[ 15.5% - 16.0% ] 15.53% | 45,191 | 2.3% |
[ 15.5% - 16.0% ] 15.80% | 1,829 | 4.7% |
[ 16.0% - 16.5% ] 16.14% | 11,069 | 2.1% |
[ 17.0% - 17.5% ] 17.15% | 1,026 | 1.9% |
[ 17.5% - 18.0% ] 17.74% | 530 | 3.8% |
[ 22.0% - 22.5% ] 22.22% | 180 | 4.0% |
[ 22.5% - 23.0% ] 22.56% | 133 | 1.5% |
[ 24.5% - 25.0% ] 24.77% | 6,186 | 3.3% |
[ 26.5% - 27.0% ] 26.72% | 116 | 0.97% |
[ 29.5% - 30.0% ] 29.74% | 2,811 | 0.93% |
[ 31.5% - 32.0% ] 31.69% | 1,761 | 1.0% |