Colombian College, Under 1 year
COMPARE
Colombian
Select to Compare
College, Under 1 year
Colombian College, Under 1 year
64.0%
COLLEGE, UNDER 1 YEAR
12.4/ 100
METRIC RATING
207th/ 347
METRIC RANK
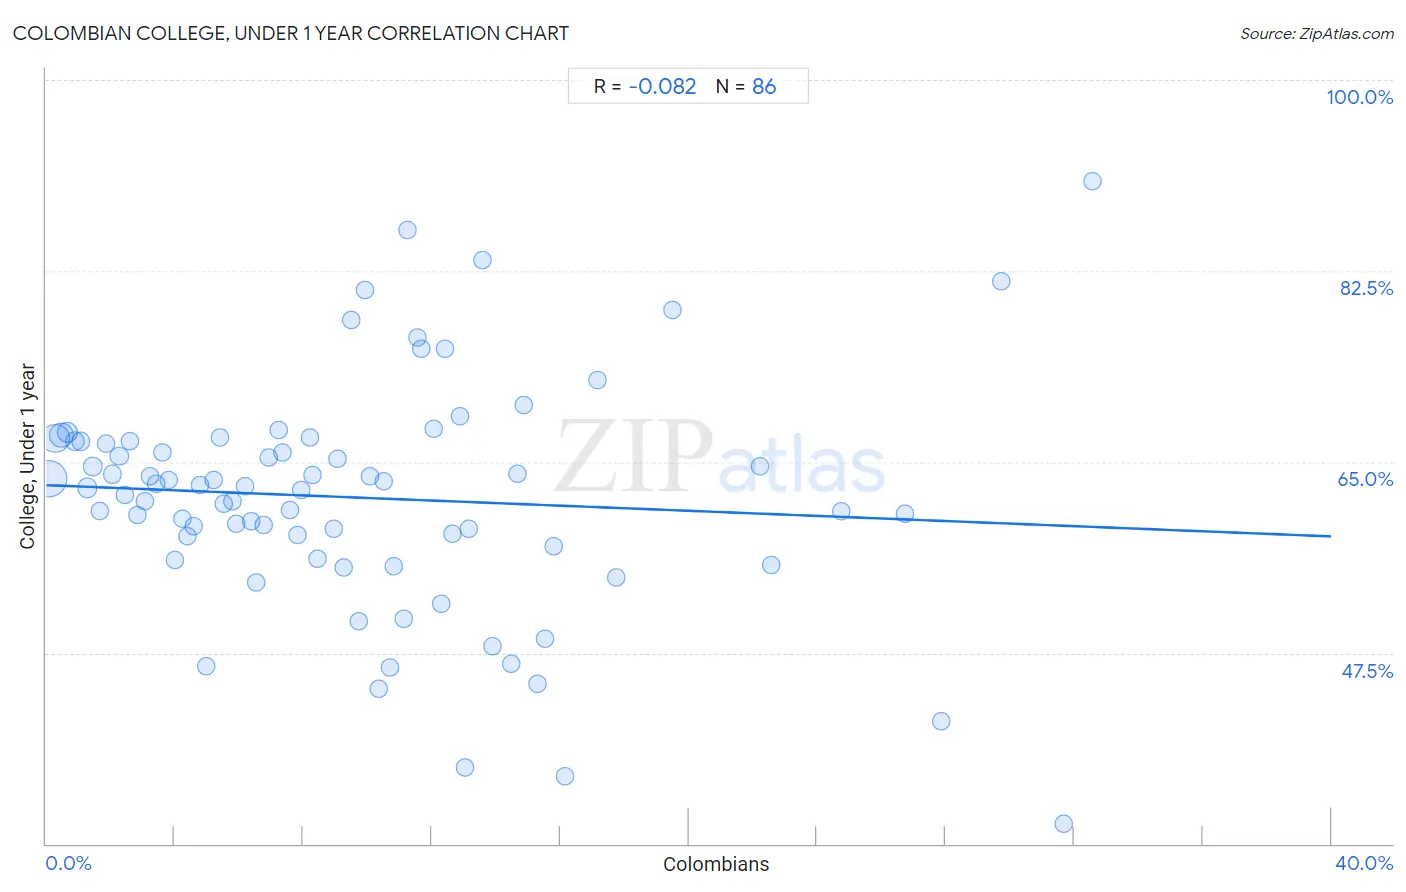
Colombian College, Under 1 year Correlation Chart
The statistical analysis conducted on geographies consisting of 419,699,674 people shows a slight negative correlation between the proportion of Colombians and percentage of population with at least college, under 1 year education in the United States with a correlation coefficient (R) of -0.082 and weighted average of 64.0%. On average, for every 1% (one percent) increase in Colombians within a typical geography, there is a decrease of 0.12% in percentage of population with at least college, under 1 year education.
It is essential to understand that the correlation between the percentage of Colombians and percentage of population with at least college, under 1 year education does not imply a direct cause-and-effect relationship. It remains uncertain whether the presence of Colombians influences an upward or downward trend in the level of percentage of population with at least college, under 1 year education within an area, or if Colombians simply ended up residing in those areas with higher or lower levels of percentage of population with at least college, under 1 year education due to other factors.
Demographics Similar to Colombians by College, Under 1 year
In terms of college, under 1 year, the demographic groups most similar to Colombians are Immigrants from Vietnam (64.0%, a difference of 0.030%), White/Caucasian (64.0%, a difference of 0.040%), Puget Sound Salish (63.9%, a difference of 0.12%), Peruvian (64.1%, a difference of 0.13%), and Ghanaian (63.9%, a difference of 0.13%).
| Demographics | Rating | Rank | College, Under 1 year |
| Nigerians | 16.7 /100 | #200 | Poor 64.3% |
| French Canadians | 16.3 /100 | #201 | Poor 64.2% |
| South Americans | 16.2 /100 | #202 | Poor 64.2% |
| Uruguayans | 15.6 /100 | #203 | Poor 64.2% |
| Immigrants from Zaire | 14.6 /100 | #204 | Poor 64.1% |
| Peruvians | 13.7 /100 | #205 | Poor 64.1% |
| Whites/Caucasians | 12.8 /100 | #206 | Poor 64.0% |
| Colombians | 12.4 /100 | #207 | Poor 64.0% |
| Immigrants from Vietnam | 12.1 /100 | #208 | Poor 64.0% |
| Puget Sound Salish | 11.3 /100 | #209 | Poor 63.9% |
| Ghanaians | 11.2 /100 | #210 | Poor 63.9% |
| Native Hawaiians | 10.6 /100 | #211 | Poor 63.9% |
| Immigrants from Middle Africa | 10.5 /100 | #212 | Poor 63.9% |
| Immigrants from South America | 9.1 /100 | #213 | Tragic 63.8% |
| Immigrants from Nigeria | 8.8 /100 | #214 | Tragic 63.7% |
Colombian College, Under 1 year Correlation Summary
| Measurement | Colombian Data | College, Under 1 year Data |
| Minimum | 0.096% | 31.8% |
| Maximum | 32.6% | 90.7% |
| Range | 32.5% | 58.9% |
| Mean | 9.8% | 61.7% |
| Median | 8.4% | 62.7% |
| Interquartile 25% (IQ1) | 4.2% | 57.3% |
| Interquartile 75% (IQ3) | 13.1% | 66.9% |
| Interquartile Range (IQR) | 8.8% | 9.6% |
| Standard Deviation (Sample) | 7.4% | 10.6% |
| Standard Deviation (Population) | 7.4% | 10.5% |
Correlation Details
| Colombian Percentile | Sample Size | College, Under 1 year |
[ 0.0% - 0.5% ] 0.096% | 170,496,528 | 63.5% |
[ 0.0% - 0.5% ] 0.28% | 97,647,785 | 67.2% |
[ 0.0% - 0.5% ] 0.47% | 53,402,783 | 67.4% |
[ 0.5% - 1.0% ] 0.67% | 24,484,093 | 67.7% |
[ 0.5% - 1.0% ] 0.88% | 13,421,848 | 66.9% |
[ 1.0% - 1.5% ] 1.07% | 8,617,182 | 66.9% |
[ 1.0% - 1.5% ] 1.27% | 15,214,912 | 62.6% |
[ 1.0% - 1.5% ] 1.46% | 5,919,730 | 64.6% |
[ 1.5% - 2.0% ] 1.66% | 3,983,515 | 60.5% |
[ 1.5% - 2.0% ] 1.85% | 2,531,100 | 66.7% |
[ 2.0% - 2.5% ] 2.05% | 2,473,950 | 63.9% |
[ 2.0% - 2.5% ] 2.27% | 1,703,070 | 65.5% |
[ 2.0% - 2.5% ] 2.46% | 1,715,202 | 62.0% |
[ 2.5% - 3.0% ] 2.62% | 1,773,508 | 66.9% |
[ 2.5% - 3.0% ] 2.83% | 1,146,067 | 60.1% |
[ 3.0% - 3.5% ] 3.07% | 1,397,308 | 61.4% |
[ 3.0% - 3.5% ] 3.25% | 658,752 | 63.7% |
[ 3.0% - 3.5% ] 3.42% | 926,510 | 63.0% |
[ 3.5% - 4.0% ] 3.63% | 1,012,035 | 65.9% |
[ 3.5% - 4.0% ] 3.81% | 762,703 | 63.4% |
[ 3.5% - 4.0% ] 4.00% | 714,483 | 56.0% |
[ 4.0% - 4.5% ] 4.24% | 1,249,112 | 59.7% |
[ 4.0% - 4.5% ] 4.40% | 639,472 | 58.2% |
[ 4.5% - 5.0% ] 4.58% | 586,289 | 59.1% |
[ 4.5% - 5.0% ] 4.78% | 425,272 | 62.9% |
[ 4.5% - 5.0% ] 4.99% | 420,845 | 46.3% |
[ 5.0% - 5.5% ] 5.20% | 545,688 | 63.4% |
[ 5.0% - 5.5% ] 5.40% | 431,367 | 67.2% |
[ 5.5% - 6.0% ] 5.54% | 329,591 | 61.2% |
[ 5.5% - 6.0% ] 5.79% | 319,482 | 61.4% |
[ 5.5% - 6.0% ] 5.91% | 86,762 | 59.3% |
[ 6.0% - 6.5% ] 6.18% | 396,251 | 62.7% |
[ 6.0% - 6.5% ] 6.38% | 496,058 | 59.6% |
[ 6.5% - 7.0% ] 6.54% | 378,044 | 53.9% |
[ 6.5% - 7.0% ] 6.76% | 337,728 | 59.2% |
[ 6.5% - 7.0% ] 6.94% | 182,201 | 65.4% |
[ 7.0% - 7.5% ] 7.23% | 88,611 | 67.9% |
[ 7.0% - 7.5% ] 7.35% | 446,829 | 65.9% |
[ 7.5% - 8.0% ] 7.58% | 77,985 | 60.6% |
[ 7.5% - 8.0% ] 7.80% | 78,531 | 58.3% |
[ 7.5% - 8.0% ] 7.94% | 140,425 | 62.4% |
[ 8.0% - 8.5% ] 8.21% | 137,791 | 67.3% |
[ 8.0% - 8.5% ] 8.27% | 72,409 | 63.8% |
[ 8.0% - 8.5% ] 8.46% | 61,991 | 56.1% |
[ 8.5% - 9.0% ] 8.95% | 135,455 | 58.8% |
[ 9.0% - 9.5% ] 9.05% | 56,025 | 65.3% |
[ 9.0% - 9.5% ] 9.26% | 75,971 | 55.3% |
[ 9.5% - 10.0% ] 9.50% | 11,577 | 78.0% |
[ 9.5% - 10.0% ] 9.73% | 130,920 | 50.4% |
[ 9.5% - 10.0% ] 9.94% | 32,881 | 80.7% |
[ 10.0% - 10.5% ] 10.06% | 75,956 | 63.7% |
[ 10.0% - 10.5% ] 10.36% | 167,404 | 44.3% |
[ 10.0% - 10.5% ] 10.49% | 67,818 | 63.3% |
[ 10.5% - 11.0% ] 10.70% | 121,225 | 46.1% |
[ 10.5% - 11.0% ] 10.81% | 74,601 | 55.5% |
[ 11.0% - 11.5% ] 11.13% | 593 | 50.7% |
[ 11.0% - 11.5% ] 11.23% | 69,599 | 86.2% |
[ 11.5% - 12.0% ] 11.55% | 42,940 | 76.5% |
[ 11.5% - 12.0% ] 11.68% | 8,024 | 75.4% |
[ 12.0% - 12.5% ] 12.07% | 149,116 | 68.0% |
[ 12.0% - 12.5% ] 12.29% | 46,195 | 52.0% |
[ 12.0% - 12.5% ] 12.43% | 118,135 | 75.4% |
[ 12.5% - 13.0% ] 12.65% | 50,975 | 58.4% |
[ 12.5% - 13.0% ] 12.87% | 119,388 | 69.2% |
[ 13.0% - 13.5% ] 13.05% | 21,715 | 37.0% |
[ 13.0% - 13.5% ] 13.16% | 342 | 58.8% |
[ 13.5% - 14.0% ] 13.58% | 31,514 | 83.5% |
[ 13.5% - 14.0% ] 13.88% | 26,548 | 48.1% |
[ 14.0% - 14.5% ] 14.48% | 359 | 46.5% |
[ 14.5% - 15.0% ] 14.68% | 42,427 | 63.9% |
[ 14.5% - 15.0% ] 14.86% | 498 | 70.2% |
[ 15.0% - 15.5% ] 15.31% | 18,601 | 44.7% |
[ 15.5% - 16.0% ] 15.53% | 45,191 | 48.8% |
[ 15.5% - 16.0% ] 15.80% | 1,829 | 57.3% |
[ 16.0% - 16.5% ] 16.14% | 11,069 | 36.2% |
[ 17.0% - 17.5% ] 17.15% | 1,026 | 72.5% |
[ 17.5% - 18.0% ] 17.74% | 530 | 54.4% |
[ 19.5% - 20.0% ] 19.51% | 41 | 78.9% |
[ 22.0% - 22.5% ] 22.22% | 180 | 64.6% |
[ 22.5% - 23.0% ] 22.56% | 133 | 55.6% |
[ 24.5% - 25.0% ] 24.77% | 6,186 | 60.5% |
[ 26.5% - 27.0% ] 26.72% | 116 | 60.3% |
[ 27.5% - 28.0% ] 27.85% | 158 | 41.2% |
[ 29.5% - 30.0% ] 29.74% | 2,811 | 81.6% |
[ 31.5% - 32.0% ] 31.69% | 1,761 | 31.8% |
[ 32.5% - 33.0% ] 32.56% | 43 | 90.7% |