Colombian Married-Couple Family Poverty
COMPARE
Colombian
Select to Compare
Married-Couple Family Poverty
Colombian Married-Couple Family Poverty
5.6%
POVERTY | MARRIED-COUPLE FAMILIES
9.2/ 100
METRIC RATING
220th/ 347
METRIC RANK
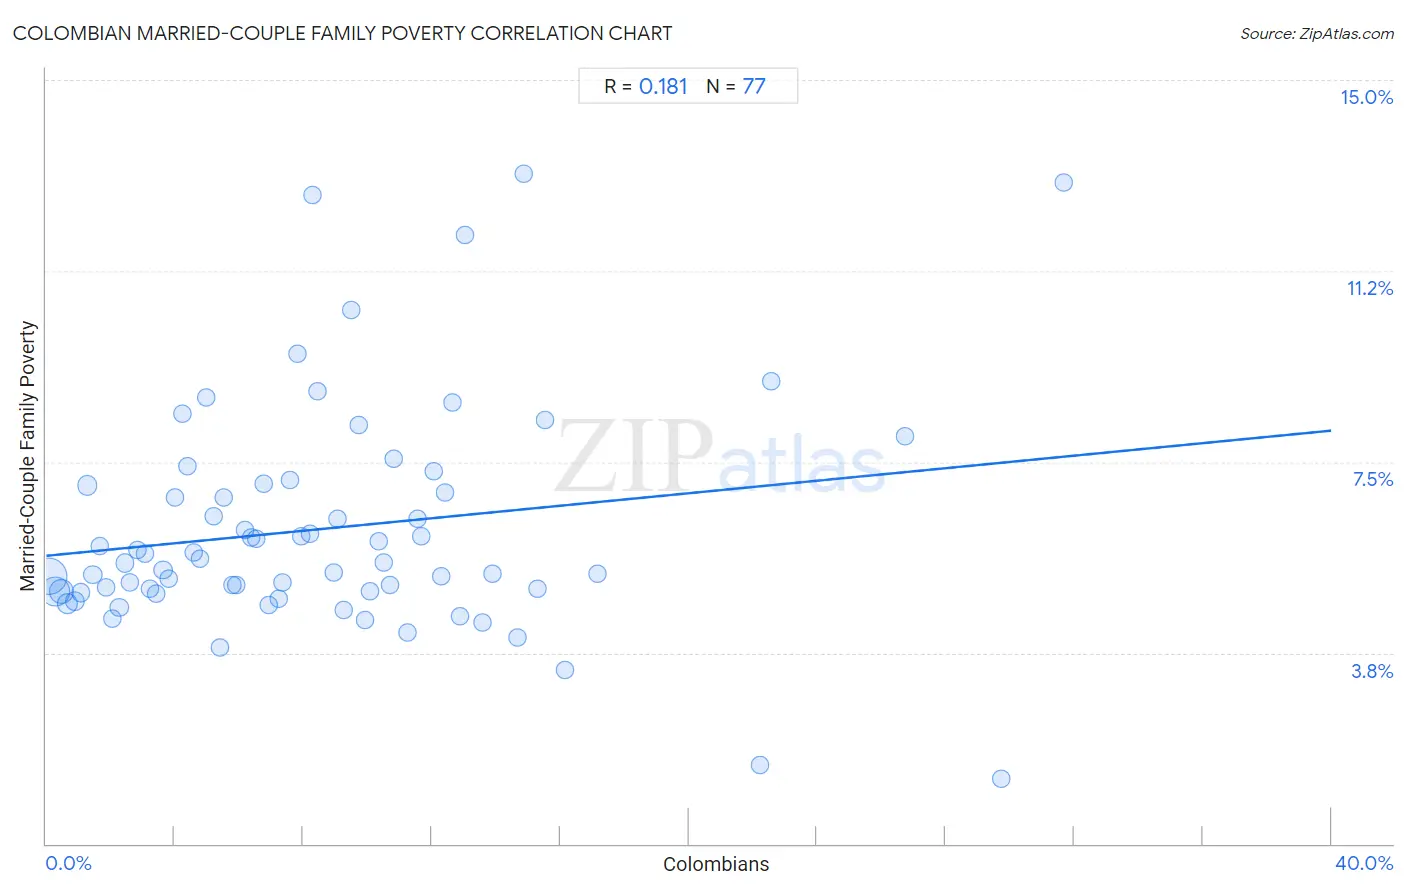
Colombian Married-Couple Family Poverty Correlation Chart
The statistical analysis conducted on geographies consisting of 415,629,712 people shows a poor positive correlation between the proportion of Colombians and poverty level among married-couple families in the United States with a correlation coefficient (R) of 0.181 and weighted average of 5.6%. On average, for every 1% (one percent) increase in Colombians within a typical geography, there is an increase of 0.061% in poverty level among married-couple families.
It is essential to understand that the correlation between the percentage of Colombians and poverty level among married-couple families does not imply a direct cause-and-effect relationship. It remains uncertain whether the presence of Colombians influences an upward or downward trend in the level of poverty level among married-couple families within an area, or if Colombians simply ended up residing in those areas with higher or lower levels of poverty level among married-couple families due to other factors.
Demographics Similar to Colombians by Married-Couple Family Poverty
In terms of married-couple family poverty, the demographic groups most similar to Colombians are Panamanian (5.6%, a difference of 0.020%), Japanese (5.6%, a difference of 0.19%), Afghan (5.5%, a difference of 0.59%), Immigrants from Nigeria (5.5%, a difference of 0.61%), and Cajun (5.6%, a difference of 0.87%).
| Demographics | Rating | Rank | Married-Couple Family Poverty |
| Immigrants from Liberia | 13.3 /100 | #213 | Poor 5.5% |
| Iroquois | 13.1 /100 | #214 | Poor 5.5% |
| Armenians | 12.8 /100 | #215 | Poor 5.5% |
| Potawatomi | 12.4 /100 | #216 | Poor 5.5% |
| Immigrants from Nigeria | 11.3 /100 | #217 | Poor 5.5% |
| Afghans | 11.2 /100 | #218 | Poor 5.5% |
| Japanese | 9.8 /100 | #219 | Tragic 5.6% |
| Colombians | 9.2 /100 | #220 | Tragic 5.6% |
| Panamanians | 9.2 /100 | #221 | Tragic 5.6% |
| Cajuns | 6.9 /100 | #222 | Tragic 5.6% |
| Immigrants from Fiji | 6.7 /100 | #223 | Tragic 5.6% |
| Sudanese | 6.4 /100 | #224 | Tragic 5.6% |
| Immigrants from Cambodia | 6.1 /100 | #225 | Tragic 5.6% |
| South Americans | 5.7 /100 | #226 | Tragic 5.6% |
| Immigrants from Zaire | 5.6 /100 | #227 | Tragic 5.6% |
Colombian Married-Couple Family Poverty Correlation Summary
| Measurement | Colombian Data | Married-Couple Family Poverty Data |
| Minimum | 0.095% | 1.3% |
| Maximum | 31.7% | 13.2% |
| Range | 31.6% | 11.9% |
| Mean | 8.6% | 6.2% |
| Median | 7.6% | 5.5% |
| Interquartile 25% (IQ1) | 3.7% | 5.0% |
| Interquartile 75% (IQ3) | 11.9% | 7.1% |
| Interquartile Range (IQR) | 8.1% | 2.1% |
| Standard Deviation (Sample) | 6.6% | 2.2% |
| Standard Deviation (Population) | 6.5% | 2.2% |
Correlation Details
| Colombian Percentile | Sample Size | Married-Couple Family Poverty |
[ 0.0% - 0.5% ] 0.095% | 169,704,672 | 5.3% |
[ 0.0% - 0.5% ] 0.28% | 96,838,322 | 5.0% |
[ 0.0% - 0.5% ] 0.47% | 52,807,186 | 5.0% |
[ 0.5% - 1.0% ] 0.67% | 24,061,774 | 4.7% |
[ 0.5% - 1.0% ] 0.88% | 13,156,049 | 4.8% |
[ 1.0% - 1.5% ] 1.07% | 8,344,327 | 4.9% |
[ 1.0% - 1.5% ] 1.27% | 15,051,757 | 7.0% |
[ 1.0% - 1.5% ] 1.46% | 5,782,920 | 5.3% |
[ 1.5% - 2.0% ] 1.66% | 3,933,635 | 5.9% |
[ 1.5% - 2.0% ] 1.85% | 2,454,479 | 5.0% |
[ 2.0% - 2.5% ] 2.06% | 2,397,720 | 4.4% |
[ 2.0% - 2.5% ] 2.27% | 1,651,433 | 4.6% |
[ 2.0% - 2.5% ] 2.46% | 1,692,407 | 5.5% |
[ 2.5% - 3.0% ] 2.62% | 1,752,200 | 5.1% |
[ 2.5% - 3.0% ] 2.83% | 1,105,476 | 5.8% |
[ 3.0% - 3.5% ] 3.07% | 1,347,030 | 5.7% |
[ 3.0% - 3.5% ] 3.25% | 651,504 | 5.0% |
[ 3.0% - 3.5% ] 3.42% | 905,315 | 4.9% |
[ 3.5% - 4.0% ] 3.64% | 992,690 | 5.4% |
[ 3.5% - 4.0% ] 3.81% | 747,582 | 5.2% |
[ 4.0% - 4.5% ] 4.00% | 702,693 | 6.8% |
[ 4.0% - 4.5% ] 4.24% | 1,234,188 | 8.4% |
[ 4.0% - 4.5% ] 4.40% | 629,212 | 7.4% |
[ 4.5% - 5.0% ] 4.58% | 574,840 | 5.7% |
[ 4.5% - 5.0% ] 4.78% | 411,102 | 5.6% |
[ 4.5% - 5.0% ] 4.99% | 419,501 | 8.8% |
[ 5.0% - 5.5% ] 5.20% | 540,671 | 6.4% |
[ 5.0% - 5.5% ] 5.40% | 428,490 | 3.9% |
[ 5.5% - 6.0% ] 5.54% | 328,014 | 6.8% |
[ 5.5% - 6.0% ] 5.79% | 300,996 | 5.1% |
[ 5.5% - 6.0% ] 5.91% | 77,245 | 5.1% |
[ 6.0% - 6.5% ] 6.18% | 390,602 | 6.2% |
[ 6.0% - 6.5% ] 6.38% | 492,541 | 6.0% |
[ 6.5% - 7.0% ] 6.54% | 377,213 | 6.0% |
[ 6.5% - 7.0% ] 6.76% | 336,966 | 7.1% |
[ 6.5% - 7.0% ] 6.94% | 182,201 | 4.7% |
[ 7.0% - 7.5% ] 7.24% | 84,316 | 4.8% |
[ 7.0% - 7.5% ] 7.35% | 446,145 | 5.1% |
[ 7.5% - 8.0% ] 7.58% | 74,711 | 7.2% |
[ 7.5% - 8.0% ] 7.80% | 78,531 | 9.6% |
[ 7.5% - 8.0% ] 7.94% | 135,811 | 6.0% |
[ 8.0% - 8.5% ] 8.21% | 135,918 | 6.1% |
[ 8.0% - 8.5% ] 8.27% | 71,012 | 12.7% |
[ 8.0% - 8.5% ] 8.45% | 57,460 | 8.9% |
[ 8.5% - 9.0% ] 8.95% | 135,455 | 5.3% |
[ 9.0% - 9.5% ] 9.05% | 55,872 | 6.4% |
[ 9.0% - 9.5% ] 9.26% | 73,836 | 4.6% |
[ 9.5% - 10.0% ] 9.50% | 11,240 | 10.5% |
[ 9.5% - 10.0% ] 9.73% | 130,920 | 8.2% |
[ 9.5% - 10.0% ] 9.94% | 32,881 | 4.4% |
[ 10.0% - 10.5% ] 10.06% | 75,659 | 5.0% |
[ 10.0% - 10.5% ] 10.36% | 161,083 | 6.0% |
[ 10.0% - 10.5% ] 10.49% | 67,617 | 5.5% |
[ 10.5% - 11.0% ] 10.70% | 121,169 | 5.1% |
[ 10.5% - 11.0% ] 10.81% | 74,601 | 7.6% |
[ 11.0% - 11.5% ] 11.23% | 69,599 | 4.2% |
[ 11.5% - 12.0% ] 11.55% | 42,940 | 6.4% |
[ 11.5% - 12.0% ] 11.68% | 8,024 | 6.0% |
[ 12.0% - 12.5% ] 12.07% | 148,452 | 7.3% |
[ 12.0% - 12.5% ] 12.29% | 46,195 | 5.3% |
[ 12.0% - 12.5% ] 12.43% | 118,135 | 6.9% |
[ 12.5% - 13.0% ] 12.65% | 50,975 | 8.7% |
[ 12.5% - 13.0% ] 12.87% | 119,388 | 4.5% |
[ 13.0% - 13.5% ] 13.05% | 20,501 | 12.0% |
[ 13.5% - 14.0% ] 13.58% | 31,514 | 4.4% |
[ 13.5% - 14.0% ] 13.88% | 26,548 | 5.3% |
[ 14.5% - 15.0% ] 14.68% | 42,207 | 4.0% |
[ 14.5% - 15.0% ] 14.86% | 498 | 13.2% |
[ 15.0% - 15.5% ] 15.31% | 18,601 | 5.0% |
[ 15.5% - 16.0% ] 15.53% | 39,849 | 8.3% |
[ 16.0% - 16.5% ] 16.14% | 11,069 | 3.4% |
[ 17.0% - 17.5% ] 17.15% | 1,026 | 5.3% |
[ 22.0% - 22.5% ] 22.22% | 180 | 1.5% |
[ 22.5% - 23.0% ] 22.56% | 133 | 9.1% |
[ 26.5% - 27.0% ] 26.72% | 116 | 8.0% |
[ 29.5% - 30.0% ] 29.74% | 2,811 | 1.3% |
[ 31.5% - 32.0% ] 31.69% | 1,761 | 13.0% |