Colombian 3 or more Vehicles in Household
COMPARE
Colombian
Select to Compare
3 or more Vehicles in Household
Colombian 3 or more Vehicles in Household
17.8%
3+ VEHICLES AVAILABLE
0.9/ 100
METRIC RATING
262nd/ 347
METRIC RANK
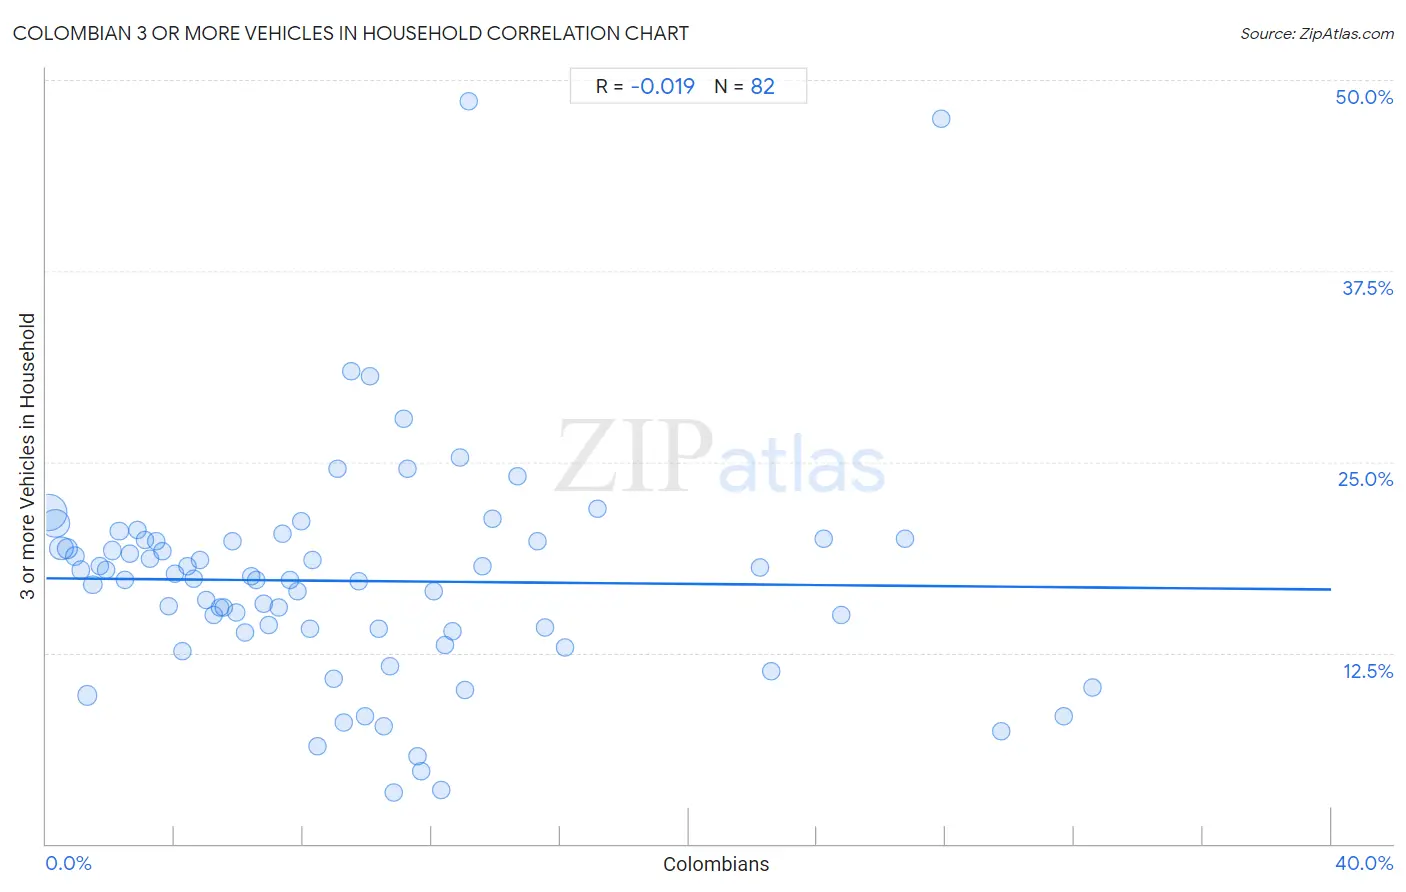
Colombian 3 or more Vehicles in Household Correlation Chart
The statistical analysis conducted on geographies consisting of 419,151,305 people shows no correlation between the proportion of Colombians and percentage of households with 3 or more vehicles available in the United States with a correlation coefficient (R) of -0.019 and weighted average of 17.8%. On average, for every 1% (one percent) increase in Colombians within a typical geography, there is a decrease of 0.018% in percentage of households with 3 or more vehicles available.
It is essential to understand that the correlation between the percentage of Colombians and percentage of households with 3 or more vehicles available does not imply a direct cause-and-effect relationship. It remains uncertain whether the presence of Colombians influences an upward or downward trend in the level of percentage of households with 3 or more vehicles available within an area, or if Colombians simply ended up residing in those areas with higher or lower levels of percentage of households with 3 or more vehicles available due to other factors.
Demographics Similar to Colombians by 3 or more Vehicles in Household
In terms of 3 or more vehicles in household, the demographic groups most similar to Colombians are Immigrants from Northern Africa (17.8%, a difference of 0.030%), Ugandan (17.8%, a difference of 0.050%), Bermudan (17.8%, a difference of 0.11%), Cambodian (17.8%, a difference of 0.14%), and Uruguayan (17.8%, a difference of 0.18%).
| Demographics | Rating | Rank | 3 or more Vehicles in Household |
| Immigrants from Turkey | 1.2 /100 | #255 | Tragic 17.9% |
| Sub-Saharan Africans | 1.1 /100 | #256 | Tragic 17.9% |
| Immigrants from Eritrea | 1.1 /100 | #257 | Tragic 17.8% |
| Sudanese | 1.1 /100 | #258 | Tragic 17.8% |
| Uruguayans | 1.0 /100 | #259 | Tragic 17.8% |
| Ugandans | 0.9 /100 | #260 | Tragic 17.8% |
| Immigrants from Northern Africa | 0.9 /100 | #261 | Tragic 17.8% |
| Colombians | 0.9 /100 | #262 | Tragic 17.8% |
| Bermudans | 0.9 /100 | #263 | Tragic 17.8% |
| Cambodians | 0.9 /100 | #264 | Tragic 17.8% |
| Immigrants from Panama | 0.8 /100 | #265 | Tragic 17.7% |
| Macedonians | 0.8 /100 | #266 | Tragic 17.7% |
| Immigrants from Venezuela | 0.8 /100 | #267 | Tragic 17.7% |
| Immigrants from Bulgaria | 0.8 /100 | #268 | Tragic 17.7% |
| Immigrants from France | 0.6 /100 | #269 | Tragic 17.6% |
Colombian 3 or more Vehicles in Household Correlation Summary
| Measurement | Colombian Data | 3 or more Vehicles in Household Data |
| Minimum | 0.096% | 3.4% |
| Maximum | 32.6% | 48.6% |
| Range | 32.5% | 45.2% |
| Mean | 9.5% | 17.2% |
| Median | 8.1% | 17.3% |
| Interquartile 25% (IQ1) | 4.0% | 13.9% |
| Interquartile 75% (IQ3) | 12.4% | 19.8% |
| Interquartile Range (IQR) | 8.4% | 5.9% |
| Standard Deviation (Sample) | 7.6% | 7.4% |
| Standard Deviation (Population) | 7.5% | 7.3% |
Correlation Details
| Colombian Percentile | Sample Size | 3 or more Vehicles in Household |
[ 0.0% - 0.5% ] 0.096% | 170,402,065 | 21.7% |
[ 0.0% - 0.5% ] 0.28% | 97,504,754 | 21.0% |
[ 0.0% - 0.5% ] 0.47% | 53,340,071 | 19.3% |
[ 0.5% - 1.0% ] 0.67% | 24,447,523 | 19.3% |
[ 0.5% - 1.0% ] 0.88% | 13,374,027 | 18.9% |
[ 1.0% - 1.5% ] 1.07% | 8,553,227 | 17.9% |
[ 1.0% - 1.5% ] 1.27% | 15,181,613 | 9.7% |
[ 1.0% - 1.5% ] 1.46% | 5,905,128 | 16.9% |
[ 1.5% - 2.0% ] 1.66% | 3,972,741 | 18.2% |
[ 1.5% - 2.0% ] 1.85% | 2,516,229 | 17.9% |
[ 2.0% - 2.5% ] 2.06% | 2,470,830 | 19.2% |
[ 2.0% - 2.5% ] 2.27% | 1,694,227 | 20.4% |
[ 2.0% - 2.5% ] 2.46% | 1,712,900 | 17.3% |
[ 2.5% - 3.0% ] 2.62% | 1,771,368 | 19.0% |
[ 2.5% - 3.0% ] 2.83% | 1,145,556 | 20.5% |
[ 3.0% - 3.5% ] 3.07% | 1,397,308 | 19.9% |
[ 3.0% - 3.5% ] 3.25% | 658,752 | 18.6% |
[ 3.0% - 3.5% ] 3.42% | 924,524 | 19.8% |
[ 3.5% - 4.0% ] 3.63% | 1,011,841 | 19.1% |
[ 3.5% - 4.0% ] 3.81% | 762,416 | 15.5% |
[ 3.5% - 4.0% ] 4.00% | 713,117 | 17.7% |
[ 4.0% - 4.5% ] 4.24% | 1,249,112 | 12.6% |
[ 4.0% - 4.5% ] 4.40% | 639,472 | 18.1% |
[ 4.5% - 5.0% ] 4.58% | 586,289 | 17.3% |
[ 4.5% - 5.0% ] 4.78% | 425,272 | 18.6% |
[ 4.5% - 5.0% ] 4.99% | 419,537 | 16.0% |
[ 5.0% - 5.5% ] 5.20% | 545,688 | 14.9% |
[ 5.0% - 5.5% ] 5.40% | 431,367 | 15.5% |
[ 5.5% - 6.0% ] 5.54% | 329,163 | 15.5% |
[ 5.5% - 6.0% ] 5.79% | 319,482 | 19.8% |
[ 5.5% - 6.0% ] 5.91% | 86,762 | 15.1% |
[ 6.0% - 6.5% ] 6.18% | 396,251 | 13.8% |
[ 6.0% - 6.5% ] 6.38% | 496,058 | 17.5% |
[ 6.5% - 7.0% ] 6.54% | 378,044 | 17.3% |
[ 6.5% - 7.0% ] 6.76% | 337,069 | 15.7% |
[ 6.5% - 7.0% ] 6.94% | 182,201 | 14.3% |
[ 7.0% - 7.5% ] 7.23% | 88,611 | 15.4% |
[ 7.0% - 7.5% ] 7.35% | 446,829 | 20.3% |
[ 7.5% - 8.0% ] 7.58% | 77,985 | 17.3% |
[ 7.5% - 8.0% ] 7.80% | 78,531 | 16.5% |
[ 7.5% - 8.0% ] 7.94% | 140,425 | 21.1% |
[ 8.0% - 8.5% ] 8.21% | 137,791 | 14.0% |
[ 8.0% - 8.5% ] 8.27% | 72,409 | 18.6% |
[ 8.0% - 8.5% ] 8.46% | 61,991 | 6.4% |
[ 8.5% - 9.0% ] 8.95% | 135,455 | 10.8% |
[ 9.0% - 9.5% ] 9.05% | 56,025 | 24.6% |
[ 9.0% - 9.5% ] 9.26% | 75,971 | 8.0% |
[ 9.5% - 10.0% ] 9.50% | 11,577 | 30.9% |
[ 9.5% - 10.0% ] 9.73% | 130,920 | 17.2% |
[ 9.5% - 10.0% ] 9.94% | 32,881 | 8.4% |
[ 10.0% - 10.5% ] 10.06% | 75,956 | 30.6% |
[ 10.0% - 10.5% ] 10.36% | 167,404 | 14.1% |
[ 10.0% - 10.5% ] 10.49% | 67,818 | 7.7% |
[ 10.5% - 11.0% ] 10.70% | 121,169 | 11.6% |
[ 10.5% - 11.0% ] 10.81% | 74,601 | 3.4% |
[ 11.0% - 11.5% ] 11.13% | 593 | 27.8% |
[ 11.0% - 11.5% ] 11.23% | 69,599 | 24.6% |
[ 11.5% - 12.0% ] 11.55% | 42,940 | 5.7% |
[ 11.5% - 12.0% ] 11.68% | 8,024 | 4.7% |
[ 12.0% - 12.5% ] 12.07% | 149,116 | 16.5% |
[ 12.0% - 12.5% ] 12.29% | 46,195 | 3.5% |
[ 12.0% - 12.5% ] 12.43% | 118,135 | 13.0% |
[ 12.5% - 13.0% ] 12.65% | 50,975 | 13.9% |
[ 12.5% - 13.0% ] 12.87% | 119,388 | 25.3% |
[ 13.0% - 13.5% ] 13.05% | 21,715 | 10.1% |
[ 13.0% - 13.5% ] 13.16% | 342 | 48.6% |
[ 13.5% - 14.0% ] 13.58% | 31,514 | 18.2% |
[ 13.5% - 14.0% ] 13.88% | 26,548 | 21.2% |
[ 14.5% - 15.0% ] 14.68% | 42,427 | 24.1% |
[ 15.0% - 15.5% ] 15.31% | 18,601 | 19.8% |
[ 15.5% - 16.0% ] 15.53% | 45,191 | 14.1% |
[ 16.0% - 16.5% ] 16.14% | 11,069 | 12.8% |
[ 17.0% - 17.5% ] 17.15% | 1,026 | 21.9% |
[ 22.0% - 22.5% ] 22.22% | 180 | 18.1% |
[ 22.5% - 23.0% ] 22.56% | 133 | 11.3% |
[ 24.0% - 24.5% ] 24.19% | 186 | 20.0% |
[ 24.5% - 25.0% ] 24.77% | 6,186 | 14.9% |
[ 26.5% - 27.0% ] 26.72% | 116 | 20.0% |
[ 27.5% - 28.0% ] 27.85% | 158 | 47.5% |
[ 29.5% - 30.0% ] 29.74% | 2,811 | 7.3% |
[ 31.5% - 32.0% ] 31.69% | 1,761 | 8.4% |
[ 32.5% - 33.0% ] 32.56% | 43 | 10.3% |