Colombian Married-couple Households
COMPARE
Colombian
Select to Compare
Married-couple Households
Colombian Married-couple Households
46.8%
MARRIED-COUPLE HOUSEHOLDS
71.0/ 100
METRIC RATING
162nd/ 347
METRIC RANK
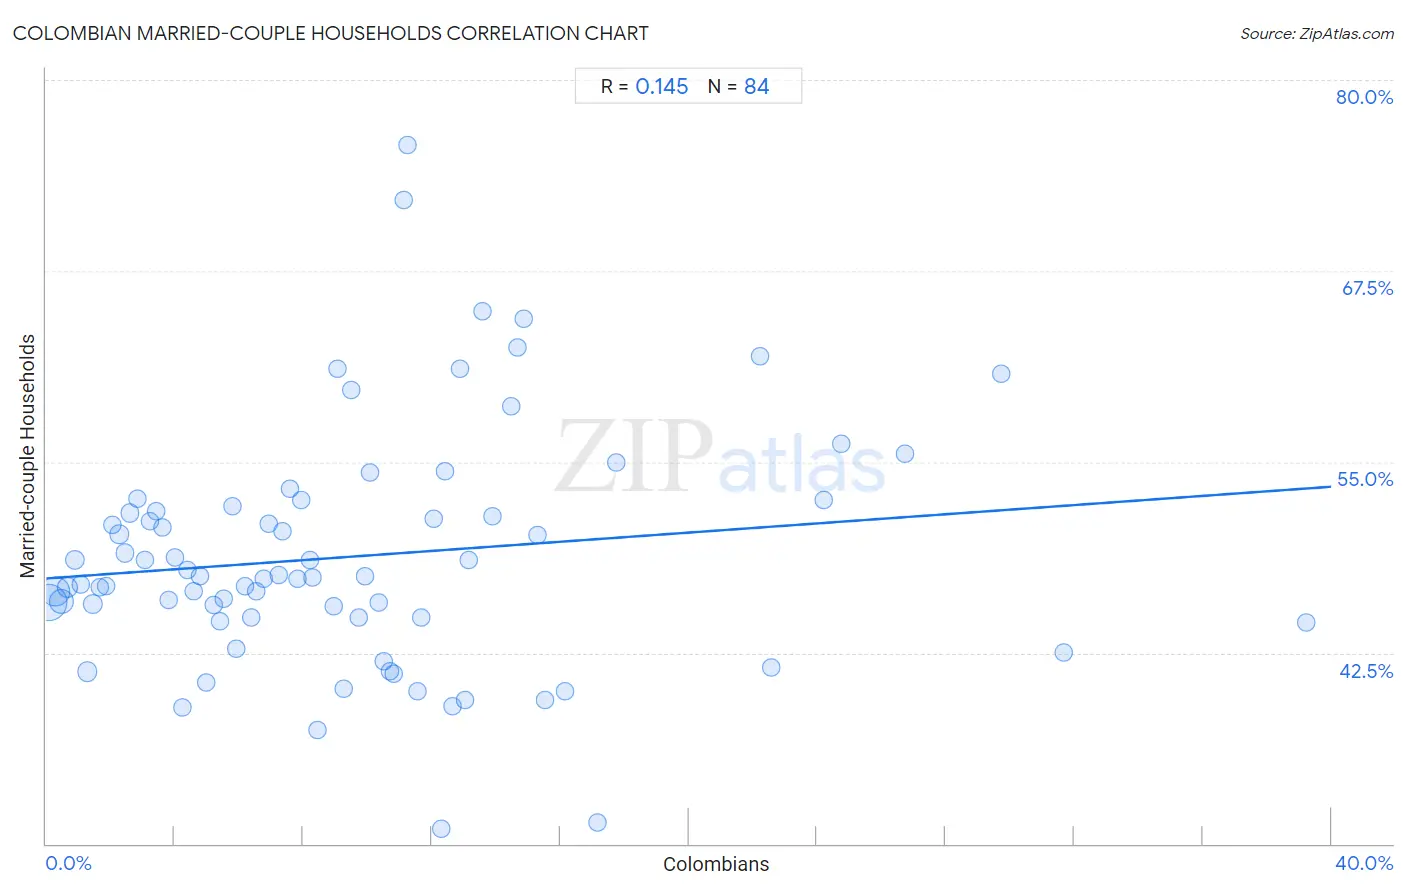
Colombian Married-couple Households Correlation Chart
The statistical analysis conducted on geographies consisting of 419,302,145 people shows a poor positive correlation between the proportion of Colombians and percentage of married-couple family households in the United States with a correlation coefficient (R) of 0.145 and weighted average of 46.8%. On average, for every 1% (one percent) increase in Colombians within a typical geography, there is an increase of 0.15% in percentage of married-couple family households.
It is essential to understand that the correlation between the percentage of Colombians and percentage of married-couple family households does not imply a direct cause-and-effect relationship. It remains uncertain whether the presence of Colombians influences an upward or downward trend in the level of percentage of married-couple family households within an area, or if Colombians simply ended up residing in those areas with higher or lower levels of percentage of married-couple family households due to other factors.
Demographics Similar to Colombians by Married-couple Households
In terms of married-couple households, the demographic groups most similar to Colombians are Delaware (46.8%, a difference of 0.010%), Iraqi (46.9%, a difference of 0.030%), Immigrants from Turkey (46.8%, a difference of 0.040%), Immigrants from Kazakhstan (46.8%, a difference of 0.050%), and Immigrants from Southern Europe (46.8%, a difference of 0.050%).
| Demographics | Rating | Rank | Married-couple Households |
| Arabs | 76.0 /100 | #155 | Good 46.9% |
| Armenians | 75.4 /100 | #156 | Good 46.9% |
| Immigrants from Oceania | 74.8 /100 | #157 | Good 46.9% |
| Nonimmigrants | 73.3 /100 | #158 | Good 46.9% |
| Osage | 73.2 /100 | #159 | Good 46.9% |
| Iraqis | 71.7 /100 | #160 | Good 46.9% |
| Delaware | 71.2 /100 | #161 | Good 46.8% |
| Colombians | 71.0 /100 | #162 | Good 46.8% |
| Immigrants from Turkey | 70.2 /100 | #163 | Good 46.8% |
| Immigrants from Kazakhstan | 70.0 /100 | #164 | Good 46.8% |
| Immigrants from Southern Europe | 69.9 /100 | #165 | Good 46.8% |
| Cherokee | 65.7 /100 | #166 | Good 46.7% |
| Immigrants from Croatia | 64.2 /100 | #167 | Good 46.7% |
| Israelis | 62.3 /100 | #168 | Good 46.7% |
| Spanish American Indians | 59.4 /100 | #169 | Average 46.6% |
Colombian Married-couple Households Correlation Summary
| Measurement | Colombian Data | Married-couple Households Data |
| Minimum | 0.096% | 31.0% |
| Maximum | 39.2% | 75.7% |
| Range | 39.1% | 44.7% |
| Mean | 9.6% | 48.8% |
| Median | 8.2% | 47.5% |
| Interquartile 25% (IQ1) | 4.1% | 44.8% |
| Interquartile 75% (IQ3) | 12.8% | 51.9% |
| Interquartile Range (IQR) | 8.6% | 7.1% |
| Standard Deviation (Sample) | 7.6% | 7.8% |
| Standard Deviation (Population) | 7.5% | 7.8% |
Correlation Details
| Colombian Percentile | Sample Size | Married-couple Households |
[ 0.0% - 0.5% ] 0.096% | 170,413,633 | 45.8% |
[ 0.0% - 0.5% ] 0.28% | 97,553,192 | 46.5% |
[ 0.0% - 0.5% ] 0.47% | 53,366,837 | 45.8% |
[ 0.5% - 1.0% ] 0.67% | 24,445,502 | 46.8% |
[ 0.5% - 1.0% ] 0.88% | 13,385,540 | 48.6% |
[ 1.0% - 1.5% ] 1.07% | 8,562,610 | 47.0% |
[ 1.0% - 1.5% ] 1.27% | 15,190,414 | 41.3% |
[ 1.0% - 1.5% ] 1.46% | 5,911,153 | 45.7% |
[ 1.5% - 2.0% ] 1.66% | 3,978,541 | 46.8% |
[ 1.5% - 2.0% ] 1.85% | 2,526,716 | 46.9% |
[ 2.0% - 2.5% ] 2.05% | 2,472,612 | 50.9% |
[ 2.0% - 2.5% ] 2.27% | 1,703,070 | 50.3% |
[ 2.0% - 2.5% ] 2.46% | 1,711,778 | 49.0% |
[ 2.5% - 3.0% ] 2.62% | 1,771,368 | 51.7% |
[ 2.5% - 3.0% ] 2.83% | 1,145,556 | 52.6% |
[ 3.0% - 3.5% ] 3.07% | 1,397,308 | 48.6% |
[ 3.0% - 3.5% ] 3.25% | 658,752 | 51.1% |
[ 3.0% - 3.5% ] 3.42% | 924,524 | 51.8% |
[ 3.5% - 4.0% ] 3.63% | 1,012,035 | 50.7% |
[ 3.5% - 4.0% ] 3.81% | 762,416 | 46.0% |
[ 3.5% - 4.0% ] 4.00% | 714,036 | 48.7% |
[ 4.0% - 4.5% ] 4.24% | 1,249,112 | 38.9% |
[ 4.0% - 4.5% ] 4.40% | 639,472 | 47.9% |
[ 4.5% - 5.0% ] 4.58% | 586,289 | 46.5% |
[ 4.5% - 5.0% ] 4.78% | 425,272 | 47.5% |
[ 4.5% - 5.0% ] 4.99% | 420,845 | 40.6% |
[ 5.0% - 5.5% ] 5.20% | 545,688 | 45.6% |
[ 5.0% - 5.5% ] 5.40% | 431,367 | 44.5% |
[ 5.5% - 6.0% ] 5.54% | 329,163 | 46.1% |
[ 5.5% - 6.0% ] 5.79% | 319,482 | 52.1% |
[ 5.5% - 6.0% ] 5.91% | 86,762 | 42.8% |
[ 6.0% - 6.5% ] 6.18% | 396,251 | 46.9% |
[ 6.0% - 6.5% ] 6.38% | 496,058 | 44.8% |
[ 6.5% - 7.0% ] 6.54% | 378,044 | 46.5% |
[ 6.5% - 7.0% ] 6.76% | 337,728 | 47.4% |
[ 6.5% - 7.0% ] 6.94% | 182,201 | 50.9% |
[ 7.0% - 7.5% ] 7.23% | 88,611 | 47.6% |
[ 7.0% - 7.5% ] 7.35% | 446,829 | 50.5% |
[ 7.5% - 8.0% ] 7.58% | 77,985 | 53.2% |
[ 7.5% - 8.0% ] 7.80% | 78,531 | 47.3% |
[ 7.5% - 8.0% ] 7.94% | 140,425 | 52.5% |
[ 8.0% - 8.5% ] 8.21% | 137,791 | 48.6% |
[ 8.0% - 8.5% ] 8.27% | 72,409 | 47.5% |
[ 8.0% - 8.5% ] 8.46% | 61,991 | 37.5% |
[ 8.5% - 9.0% ] 8.95% | 135,455 | 45.6% |
[ 9.0% - 9.5% ] 9.05% | 56,025 | 61.1% |
[ 9.0% - 9.5% ] 9.26% | 75,971 | 40.1% |
[ 9.5% - 10.0% ] 9.50% | 11,577 | 59.7% |
[ 9.5% - 10.0% ] 9.73% | 130,920 | 44.8% |
[ 9.5% - 10.0% ] 9.94% | 32,881 | 47.5% |
[ 10.0% - 10.5% ] 10.06% | 75,956 | 54.3% |
[ 10.0% - 10.5% ] 10.36% | 167,404 | 45.8% |
[ 10.0% - 10.5% ] 10.49% | 67,818 | 42.0% |
[ 10.5% - 11.0% ] 10.70% | 121,225 | 41.3% |
[ 10.5% - 11.0% ] 10.81% | 74,601 | 41.1% |
[ 11.0% - 11.5% ] 11.13% | 593 | 72.2% |
[ 11.0% - 11.5% ] 11.23% | 69,599 | 75.7% |
[ 11.5% - 12.0% ] 11.55% | 42,940 | 40.0% |
[ 11.5% - 12.0% ] 11.68% | 8,024 | 44.8% |
[ 12.0% - 12.5% ] 12.07% | 149,116 | 51.3% |
[ 12.0% - 12.5% ] 12.29% | 46,195 | 31.0% |
[ 12.0% - 12.5% ] 12.43% | 118,135 | 54.4% |
[ 12.5% - 13.0% ] 12.65% | 50,975 | 39.0% |
[ 12.5% - 13.0% ] 12.87% | 119,388 | 61.1% |
[ 13.0% - 13.5% ] 13.05% | 21,715 | 39.4% |
[ 13.0% - 13.5% ] 13.16% | 342 | 48.6% |
[ 13.5% - 14.0% ] 13.58% | 31,514 | 64.9% |
[ 13.5% - 14.0% ] 13.88% | 26,548 | 51.5% |
[ 14.0% - 14.5% ] 14.48% | 359 | 58.7% |
[ 14.5% - 15.0% ] 14.68% | 42,427 | 62.5% |
[ 14.5% - 15.0% ] 14.86% | 498 | 64.4% |
[ 15.0% - 15.5% ] 15.31% | 18,601 | 50.2% |
[ 15.5% - 16.0% ] 15.53% | 45,191 | 39.4% |
[ 16.0% - 16.5% ] 16.14% | 11,069 | 40.0% |
[ 17.0% - 17.5% ] 17.15% | 1,026 | 31.4% |
[ 17.5% - 18.0% ] 17.74% | 530 | 54.9% |
[ 22.0% - 22.5% ] 22.22% | 180 | 61.9% |
[ 22.5% - 23.0% ] 22.56% | 133 | 41.5% |
[ 24.0% - 24.5% ] 24.19% | 186 | 52.5% |
[ 24.5% - 25.0% ] 24.77% | 6,186 | 56.2% |
[ 26.5% - 27.0% ] 26.72% | 116 | 55.6% |
[ 29.5% - 30.0% ] 29.74% | 2,811 | 60.7% |
[ 31.5% - 32.0% ] 31.69% | 1,761 | 42.5% |
[ 39.0% - 39.5% ] 39.22% | 255 | 44.4% |