Choctaw High School Diploma
COMPARE
Choctaw
Select to Compare
High School Diploma
Choctaw High School Diploma
87.8%
HIGH SCHOOL DIPLOMA
1.9/ 100
METRIC RATING
244th/ 347
METRIC RANK
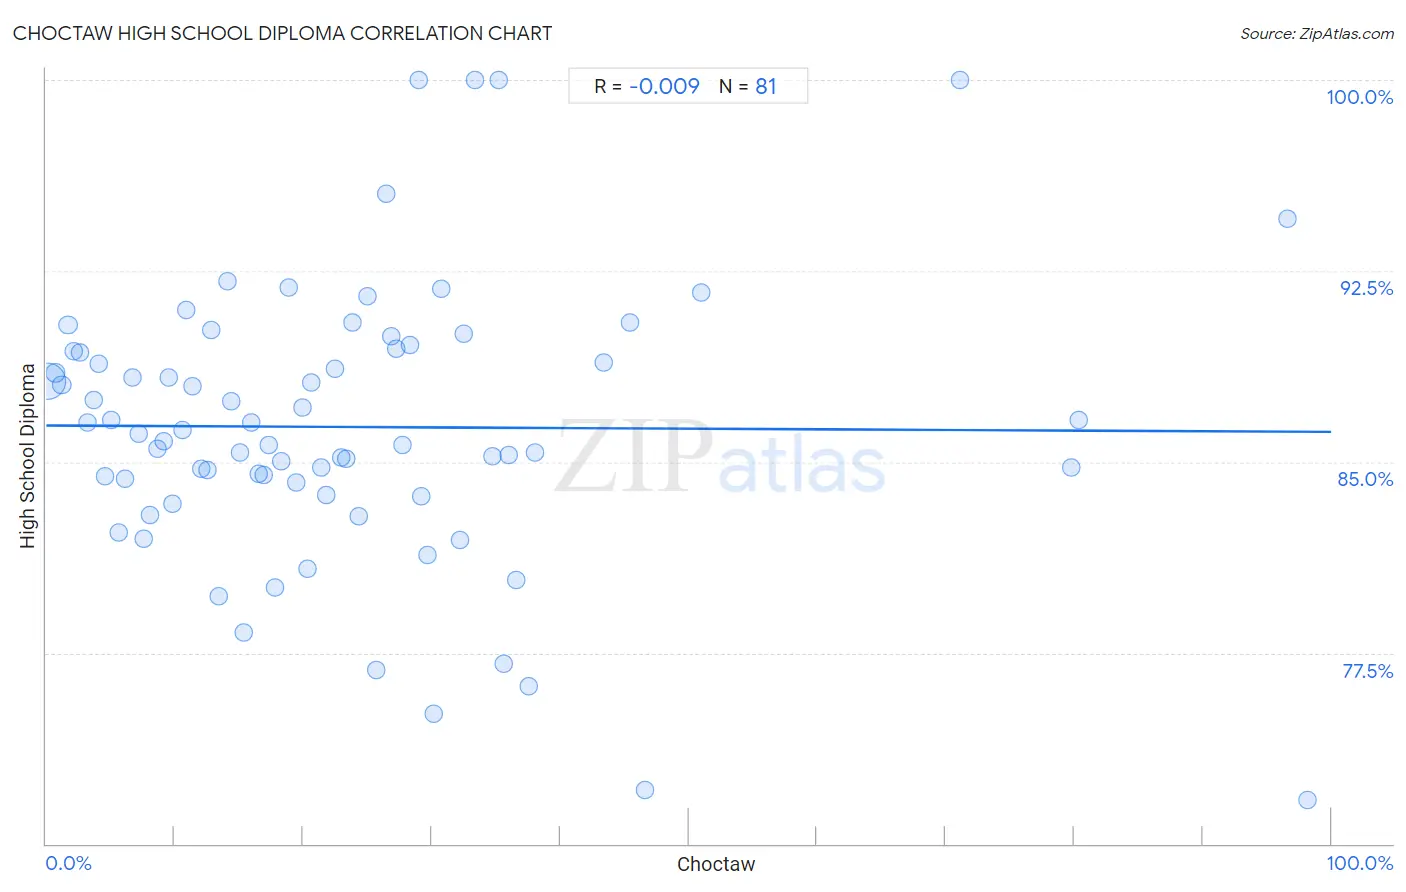
Choctaw High School Diploma Correlation Chart
The statistical analysis conducted on geographies consisting of 269,738,650 people shows no correlation between the proportion of Choctaw and percentage of population with at least high school diploma education in the United States with a correlation coefficient (R) of -0.009 and weighted average of 87.8%. On average, for every 1% (one percent) increase in Choctaw within a typical geography, there is a decrease of 0.0025% in percentage of population with at least high school diploma education.
It is essential to understand that the correlation between the percentage of Choctaw and percentage of population with at least high school diploma education does not imply a direct cause-and-effect relationship. It remains uncertain whether the presence of Choctaw influences an upward or downward trend in the level of percentage of population with at least high school diploma education within an area, or if Choctaw simply ended up residing in those areas with higher or lower levels of percentage of population with at least high school diploma education due to other factors.
Demographics Similar to Choctaw by High School Diploma
In terms of high school diploma, the demographic groups most similar to Choctaw are Immigrants from Philippines (87.8%, a difference of 0.0%), Peruvian (87.8%, a difference of 0.010%), Immigrants from Uzbekistan (87.8%, a difference of 0.030%), Cheyenne (87.8%, a difference of 0.030%), and Immigrants from Eritrea (87.8%, a difference of 0.040%).
| Demographics | Rating | Rank | High School Diploma |
| Taiwanese | 2.8 /100 | #237 | Tragic 87.9% |
| Sioux | 2.7 /100 | #238 | Tragic 87.9% |
| South Americans | 2.7 /100 | #239 | Tragic 87.9% |
| Comanche | 2.2 /100 | #240 | Tragic 87.9% |
| Immigrants from Uzbekistan | 2.1 /100 | #241 | Tragic 87.8% |
| Cheyenne | 2.1 /100 | #242 | Tragic 87.8% |
| Immigrants from Philippines | 1.9 /100 | #243 | Tragic 87.8% |
| Choctaw | 1.9 /100 | #244 | Tragic 87.8% |
| Peruvians | 1.9 /100 | #245 | Tragic 87.8% |
| Immigrants from Eritrea | 1.7 /100 | #246 | Tragic 87.8% |
| Immigrants from Costa Rica | 1.7 /100 | #247 | Tragic 87.8% |
| Spanish Americans | 1.5 /100 | #248 | Tragic 87.7% |
| Senegalese | 1.5 /100 | #249 | Tragic 87.7% |
| Immigrants from Nigeria | 1.5 /100 | #250 | Tragic 87.7% |
| Ghanaians | 1.4 /100 | #251 | Tragic 87.7% |
Choctaw High School Diploma Correlation Summary
| Measurement | Choctaw Data | High School Diploma Data |
| Minimum | 0.081% | 71.7% |
| Maximum | 98.1% | 100.0% |
| Range | 98.1% | 28.3% |
| Mean | 23.6% | 86.4% |
| Median | 19.9% | 86.1% |
| Interquartile 25% (IQ1) | 9.7% | 84.0% |
| Interquartile 75% (IQ3) | 30.5% | 89.4% |
| Interquartile Range (IQR) | 20.8% | 5.4% |
| Standard Deviation (Sample) | 20.1% | 5.5% |
| Standard Deviation (Population) | 20.0% | 5.5% |
Correlation Details
| Choctaw Percentile | Sample Size | High School Diploma |
[ 0.0% - 0.5% ] 0.081% | 256,266,503 | 88.2% |
[ 0.5% - 1.0% ] 0.70% | 6,518,511 | 88.5% |
[ 1.0% - 1.5% ] 1.22% | 3,046,827 | 88.0% |
[ 1.5% - 2.0% ] 1.70% | 1,680,639 | 90.4% |
[ 2.0% - 2.5% ] 2.17% | 573,691 | 89.3% |
[ 2.5% - 3.0% ] 2.60% | 421,467 | 89.3% |
[ 3.0% - 3.5% ] 3.18% | 217,548 | 86.5% |
[ 3.5% - 4.0% ] 3.67% | 159,503 | 87.5% |
[ 4.0% - 4.5% ] 4.08% | 104,413 | 88.9% |
[ 4.5% - 5.0% ] 4.56% | 45,713 | 84.4% |
[ 5.0% - 5.5% ] 5.10% | 44,110 | 86.6% |
[ 5.5% - 6.0% ] 5.62% | 34,881 | 82.2% |
[ 6.0% - 6.5% ] 6.13% | 22,808 | 84.3% |
[ 6.5% - 7.0% ] 6.70% | 96,691 | 88.3% |
[ 7.0% - 7.5% ] 7.18% | 43,154 | 86.1% |
[ 7.5% - 8.0% ] 7.59% | 24,160 | 82.0% |
[ 8.0% - 8.5% ] 8.09% | 14,201 | 82.9% |
[ 8.5% - 9.0% ] 8.61% | 26,968 | 85.5% |
[ 9.0% - 9.5% ] 9.14% | 4,374 | 85.8% |
[ 9.5% - 10.0% ] 9.54% | 10,404 | 88.3% |
[ 9.5% - 10.0% ] 9.87% | 28,765 | 83.4% |
[ 10.5% - 11.0% ] 10.58% | 13,724 | 86.2% |
[ 10.5% - 11.0% ] 10.93% | 4,472 | 90.9% |
[ 11.0% - 11.5% ] 11.41% | 16,242 | 88.0% |
[ 12.0% - 12.5% ] 12.09% | 65,987 | 84.7% |
[ 12.5% - 13.0% ] 12.58% | 11,673 | 84.7% |
[ 12.5% - 13.0% ] 12.87% | 4,826 | 90.2% |
[ 13.0% - 13.5% ] 13.41% | 5,758 | 79.7% |
[ 14.0% - 14.5% ] 14.08% | 6,406 | 92.1% |
[ 14.0% - 14.5% ] 14.38% | 29,855 | 87.4% |
[ 15.0% - 15.5% ] 15.06% | 25,206 | 85.4% |
[ 15.0% - 15.5% ] 15.37% | 1,574 | 78.3% |
[ 15.5% - 16.0% ] 15.95% | 4,665 | 86.5% |
[ 16.5% - 17.0% ] 16.55% | 18,037 | 84.5% |
[ 16.5% - 17.0% ] 16.89% | 14,782 | 84.5% |
[ 17.0% - 17.5% ] 17.35% | 7,872 | 85.7% |
[ 17.5% - 18.0% ] 17.78% | 9,509 | 80.1% |
[ 18.0% - 18.5% ] 18.28% | 9,254 | 85.0% |
[ 18.5% - 19.0% ] 18.83% | 531 | 91.8% |
[ 19.0% - 19.5% ] 19.45% | 45,587 | 84.2% |
[ 19.5% - 20.0% ] 19.93% | 3,869 | 87.1% |
[ 20.0% - 20.5% ] 20.36% | 7,885 | 80.8% |
[ 20.5% - 21.0% ] 20.65% | 3,002 | 88.1% |
[ 21.0% - 21.5% ] 21.45% | 1,478 | 84.8% |
[ 21.5% - 22.0% ] 21.75% | 11,047 | 83.7% |
[ 22.0% - 22.5% ] 22.49% | 867 | 88.7% |
[ 22.5% - 23.0% ] 22.95% | 4,021 | 85.2% |
[ 23.0% - 23.5% ] 23.37% | 2,045 | 85.1% |
[ 23.5% - 24.0% ] 23.84% | 453 | 90.5% |
[ 24.0% - 24.5% ] 24.32% | 2,344 | 82.9% |
[ 25.0% - 25.5% ] 25.01% | 3,327 | 91.5% |
[ 25.5% - 26.0% ] 25.68% | 296 | 76.8% |
[ 26.0% - 26.5% ] 26.46% | 223 | 95.5% |
[ 26.5% - 27.0% ] 26.83% | 2,602 | 89.9% |
[ 27.0% - 27.5% ] 27.23% | 1,998 | 89.4% |
[ 27.5% - 28.0% ] 27.75% | 2,115 | 85.7% |
[ 28.0% - 28.5% ] 28.32% | 1,077 | 89.6% |
[ 28.5% - 29.0% ] 28.95% | 38 | 100.0% |
[ 29.0% - 29.5% ] 29.15% | 1,187 | 83.7% |
[ 29.5% - 30.0% ] 29.70% | 101 | 81.3% |
[ 30.0% - 30.5% ] 30.18% | 1,196 | 75.1% |
[ 30.5% - 31.0% ] 30.77% | 234 | 91.8% |
[ 32.0% - 32.5% ] 32.21% | 447 | 81.9% |
[ 32.5% - 33.0% ] 32.53% | 621 | 90.0% |
[ 33.0% - 33.5% ] 33.33% | 99 | 100.0% |
[ 34.5% - 35.0% ] 34.75% | 141 | 85.2% |
[ 35.0% - 35.5% ] 35.21% | 71 | 100.0% |
[ 35.5% - 36.0% ] 35.58% | 579 | 77.1% |
[ 36.0% - 36.5% ] 36.03% | 136 | 85.3% |
[ 36.5% - 37.0% ] 36.54% | 156 | 80.4% |
[ 37.0% - 37.5% ] 37.50% | 40 | 76.2% |
[ 37.5% - 38.0% ] 38.00% | 350 | 85.4% |
[ 43.0% - 43.5% ] 43.42% | 76 | 88.9% |
[ 45.0% - 45.5% ] 45.40% | 1,240 | 90.5% |
[ 46.5% - 47.0% ] 46.58% | 73 | 72.1% |
[ 50.5% - 51.0% ] 50.94% | 53 | 91.7% |
[ 71.0% - 71.5% ] 71.11% | 90 | 100.0% |
[ 79.5% - 80.0% ] 79.76% | 573 | 84.8% |
[ 80.0% - 80.5% ] 80.35% | 514 | 86.7% |
[ 96.5% - 97.0% ] 96.55% | 319 | 94.6% |
[ 98.0% - 98.5% ] 98.14% | 376 | 71.7% |