Choctaw Disability
COMPARE
Choctaw
Select to Compare
Disability
Choctaw Disability
15.4%
DISABILITY
0.0/ 100
METRIC RATING
340th/ 347
METRIC RANK
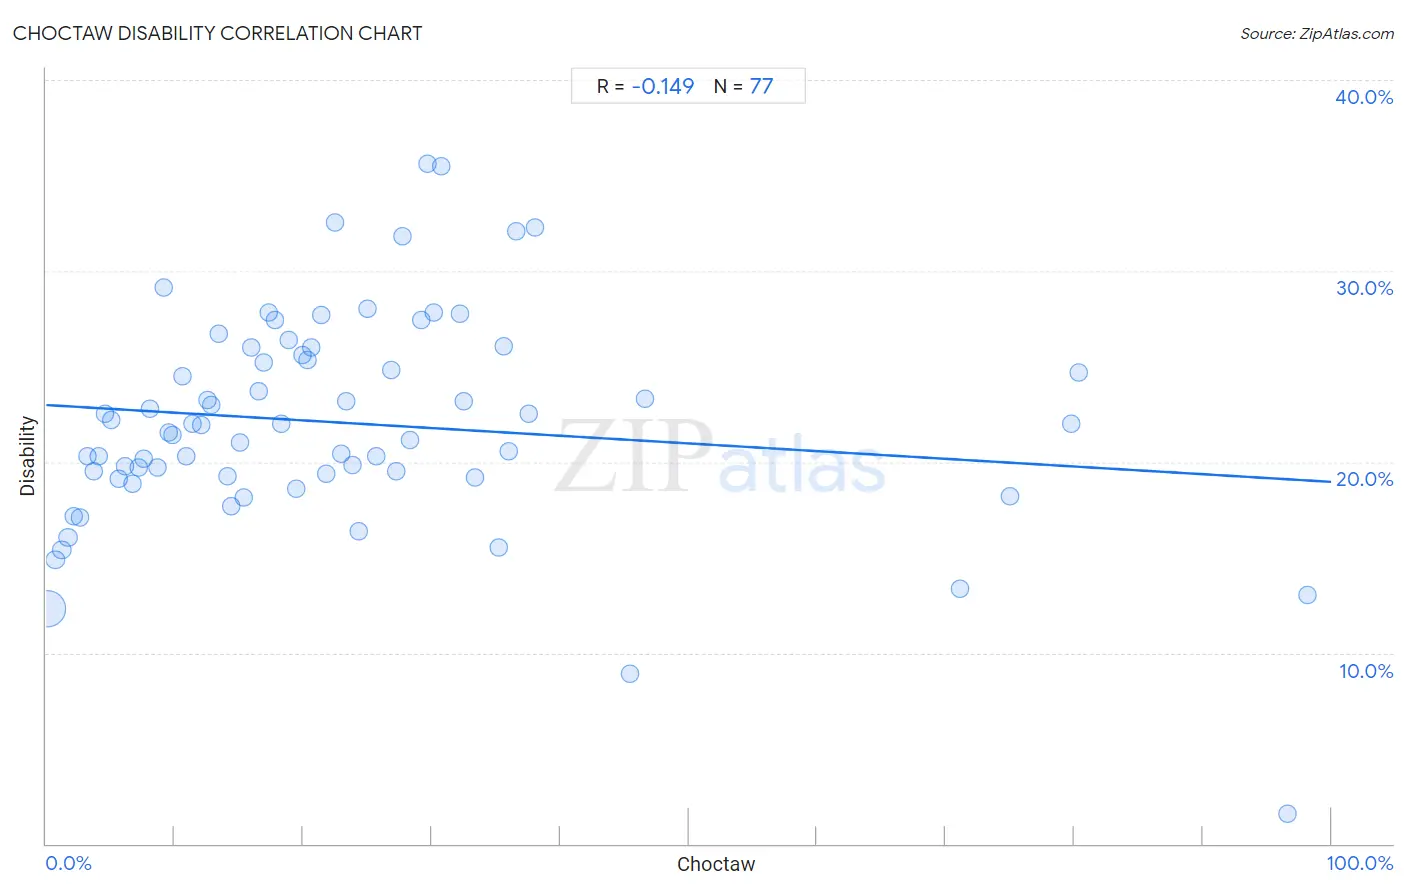
Choctaw Disability Correlation Chart
The statistical analysis conducted on geographies consisting of 269,676,270 people shows a poor negative correlation between the proportion of Choctaw and percentage of population with a disability in the United States with a correlation coefficient (R) of -0.149 and weighted average of 15.4%. On average, for every 1% (one percent) increase in Choctaw within a typical geography, there is a decrease of 0.040% in percentage of population with a disability.
It is essential to understand that the correlation between the percentage of Choctaw and percentage of population with a disability does not imply a direct cause-and-effect relationship. It remains uncertain whether the presence of Choctaw influences an upward or downward trend in the level of percentage of population with a disability within an area, or if Choctaw simply ended up residing in those areas with higher or lower levels of percentage of population with a disability due to other factors.
Demographics Similar to Choctaw by Disability
In terms of disability, the demographic groups most similar to Choctaw are Lumbee (15.5%, a difference of 0.84%), Kiowa (15.6%, a difference of 1.3%), Creek (15.6%, a difference of 1.3%), Chickasaw (15.2%, a difference of 1.5%), and Colville (15.8%, a difference of 2.6%).
| Demographics | Rating | Rank | Disability |
| Cajuns | 0.0 /100 | #333 | Tragic 14.6% |
| Yuman | 0.0 /100 | #334 | Tragic 14.6% |
| Tohono O'odham | 0.0 /100 | #335 | Tragic 14.8% |
| Cherokee | 0.0 /100 | #336 | Tragic 14.8% |
| Seminole | 0.0 /100 | #337 | Tragic 14.9% |
| Dutch West Indians | 0.0 /100 | #338 | Tragic 14.9% |
| Chickasaw | 0.0 /100 | #339 | Tragic 15.2% |
| Choctaw | 0.0 /100 | #340 | Tragic 15.4% |
| Lumbee | 0.0 /100 | #341 | Tragic 15.5% |
| Kiowa | 0.0 /100 | #342 | Tragic 15.6% |
| Creek | 0.0 /100 | #343 | Tragic 15.6% |
| Colville | 0.0 /100 | #344 | Tragic 15.8% |
| Puerto Ricans | 0.0 /100 | #345 | Tragic 16.1% |
| Tsimshian | 0.0 /100 | #346 | Tragic 16.1% |
| Houma | 0.0 /100 | #347 | Tragic 17.1% |
Choctaw Disability Correlation Summary
| Measurement | Choctaw Data | Disability Data |
| Minimum | 0.081% | 1.6% |
| Maximum | 98.1% | 35.6% |
| Range | 98.1% | 34.1% |
| Mean | 23.4% | 22.0% |
| Median | 18.8% | 21.9% |
| Interquartile 25% (IQ1) | 9.3% | 19.2% |
| Interquartile 75% (IQ3) | 29.9% | 25.8% |
| Interquartile Range (IQR) | 20.6% | 6.6% |
| Standard Deviation (Sample) | 21.0% | 5.7% |
| Standard Deviation (Population) | 20.9% | 5.7% |
Correlation Details
| Choctaw Percentile | Sample Size | Disability |
[ 0.0% - 0.5% ] 0.081% | 256,219,614 | 12.3% |
[ 0.5% - 1.0% ] 0.70% | 6,504,949 | 14.9% |
[ 1.0% - 1.5% ] 1.22% | 3,043,704 | 15.4% |
[ 1.5% - 2.0% ] 1.70% | 1,678,813 | 16.0% |
[ 2.0% - 2.5% ] 2.17% | 573,450 | 17.2% |
[ 2.5% - 3.0% ] 2.60% | 421,467 | 17.1% |
[ 3.0% - 3.5% ] 3.18% | 217,458 | 20.3% |
[ 3.5% - 4.0% ] 3.67% | 159,503 | 19.5% |
[ 4.0% - 4.5% ] 4.08% | 104,413 | 20.3% |
[ 4.5% - 5.0% ] 4.56% | 45,713 | 22.5% |
[ 5.0% - 5.5% ] 5.10% | 44,110 | 22.2% |
[ 5.5% - 6.0% ] 5.62% | 34,881 | 19.1% |
[ 6.0% - 6.5% ] 6.13% | 22,808 | 19.8% |
[ 6.5% - 7.0% ] 6.70% | 96,691 | 18.9% |
[ 7.0% - 7.5% ] 7.18% | 43,154 | 19.7% |
[ 7.5% - 8.0% ] 7.59% | 24,160 | 20.1% |
[ 8.0% - 8.5% ] 8.09% | 14,201 | 22.8% |
[ 8.5% - 9.0% ] 8.61% | 26,900 | 19.7% |
[ 9.0% - 9.5% ] 9.14% | 4,374 | 29.1% |
[ 9.5% - 10.0% ] 9.54% | 10,404 | 21.6% |
[ 9.5% - 10.0% ] 9.87% | 28,765 | 21.4% |
[ 10.5% - 11.0% ] 10.58% | 13,724 | 24.5% |
[ 10.5% - 11.0% ] 10.93% | 4,472 | 20.3% |
[ 11.0% - 11.5% ] 11.41% | 16,242 | 22.0% |
[ 12.0% - 12.5% ] 12.09% | 65,987 | 21.9% |
[ 12.5% - 13.0% ] 12.58% | 11,673 | 23.3% |
[ 12.5% - 13.0% ] 12.87% | 4,826 | 23.0% |
[ 13.0% - 13.5% ] 13.41% | 5,758 | 26.7% |
[ 14.0% - 14.5% ] 14.08% | 6,406 | 19.2% |
[ 14.0% - 14.5% ] 14.38% | 29,855 | 17.7% |
[ 15.0% - 15.5% ] 15.06% | 25,206 | 21.0% |
[ 15.0% - 15.5% ] 15.37% | 1,574 | 18.1% |
[ 15.5% - 16.0% ] 15.95% | 4,665 | 26.0% |
[ 16.5% - 17.0% ] 16.55% | 18,037 | 23.7% |
[ 16.5% - 17.0% ] 16.89% | 14,782 | 25.2% |
[ 17.0% - 17.5% ] 17.35% | 7,872 | 27.8% |
[ 17.5% - 18.0% ] 17.78% | 9,509 | 27.4% |
[ 18.0% - 18.5% ] 18.28% | 9,031 | 22.0% |
[ 18.5% - 19.0% ] 18.83% | 531 | 26.4% |
[ 19.0% - 19.5% ] 19.45% | 45,462 | 18.6% |
[ 19.5% - 20.0% ] 19.93% | 3,869 | 25.6% |
[ 20.0% - 20.5% ] 20.36% | 7,885 | 25.3% |
[ 20.5% - 21.0% ] 20.65% | 3,002 | 26.0% |
[ 21.0% - 21.5% ] 21.45% | 1,478 | 27.7% |
[ 21.5% - 22.0% ] 21.75% | 11,047 | 19.4% |
[ 22.0% - 22.5% ] 22.49% | 867 | 32.5% |
[ 22.5% - 23.0% ] 22.95% | 4,021 | 20.4% |
[ 23.0% - 23.5% ] 23.37% | 2,045 | 23.2% |
[ 23.5% - 24.0% ] 23.84% | 453 | 19.9% |
[ 24.0% - 24.5% ] 24.32% | 2,344 | 16.3% |
[ 25.0% - 25.5% ] 25.01% | 3,327 | 28.0% |
[ 25.5% - 26.0% ] 25.68% | 296 | 20.3% |
[ 26.5% - 27.0% ] 26.83% | 2,602 | 24.8% |
[ 27.0% - 27.5% ] 27.23% | 1,998 | 19.5% |
[ 27.5% - 28.0% ] 27.75% | 2,115 | 31.8% |
[ 28.0% - 28.5% ] 28.32% | 1,077 | 21.2% |
[ 29.0% - 29.5% ] 29.15% | 1,187 | 27.5% |
[ 29.5% - 30.0% ] 29.70% | 101 | 35.6% |
[ 30.0% - 30.5% ] 30.18% | 1,196 | 27.8% |
[ 30.5% - 31.0% ] 30.77% | 234 | 35.5% |
[ 32.0% - 32.5% ] 32.21% | 447 | 27.7% |
[ 32.5% - 33.0% ] 32.53% | 621 | 23.2% |
[ 33.0% - 33.5% ] 33.33% | 99 | 19.2% |
[ 35.0% - 35.5% ] 35.21% | 71 | 15.5% |
[ 35.5% - 36.0% ] 35.58% | 579 | 26.1% |
[ 36.0% - 36.5% ] 36.03% | 136 | 20.6% |
[ 36.5% - 37.0% ] 36.54% | 156 | 32.1% |
[ 37.0% - 37.5% ] 37.50% | 40 | 22.5% |
[ 37.5% - 38.0% ] 38.00% | 350 | 32.3% |
[ 45.0% - 45.5% ] 45.40% | 1,240 | 8.9% |
[ 46.5% - 47.0% ] 46.58% | 73 | 23.3% |
[ 71.0% - 71.5% ] 71.11% | 90 | 13.3% |
[ 75.0% - 75.5% ] 75.03% | 4,298 | 18.2% |
[ 79.5% - 80.0% ] 79.76% | 573 | 22.0% |
[ 80.0% - 80.5% ] 80.35% | 514 | 24.7% |
[ 96.5% - 97.0% ] 96.55% | 319 | 1.6% |
[ 98.0% - 98.5% ] 98.14% | 376 | 13.0% |