Choctaw Married-Couple Family Poverty
COMPARE
Choctaw
Select to Compare
Married-Couple Family Poverty
Choctaw Married-Couple Family Poverty
6.3%
POVERTY | MARRIED-COUPLE FAMILIES
0.1/ 100
METRIC RATING
275th/ 347
METRIC RANK
Choctaw Married-Couple Family Poverty Correlation Chart
The statistical analysis conducted on geographies consisting of 268,584,402 people shows a moderate positive correlation between the proportion of Choctaw and poverty level among married-couple families in the United States with a correlation coefficient (R) of 0.454 and weighted average of 6.3%. On average, for every 1% (one percent) increase in Choctaw within a typical geography, there is an increase of 0.20% in poverty level among married-couple families.
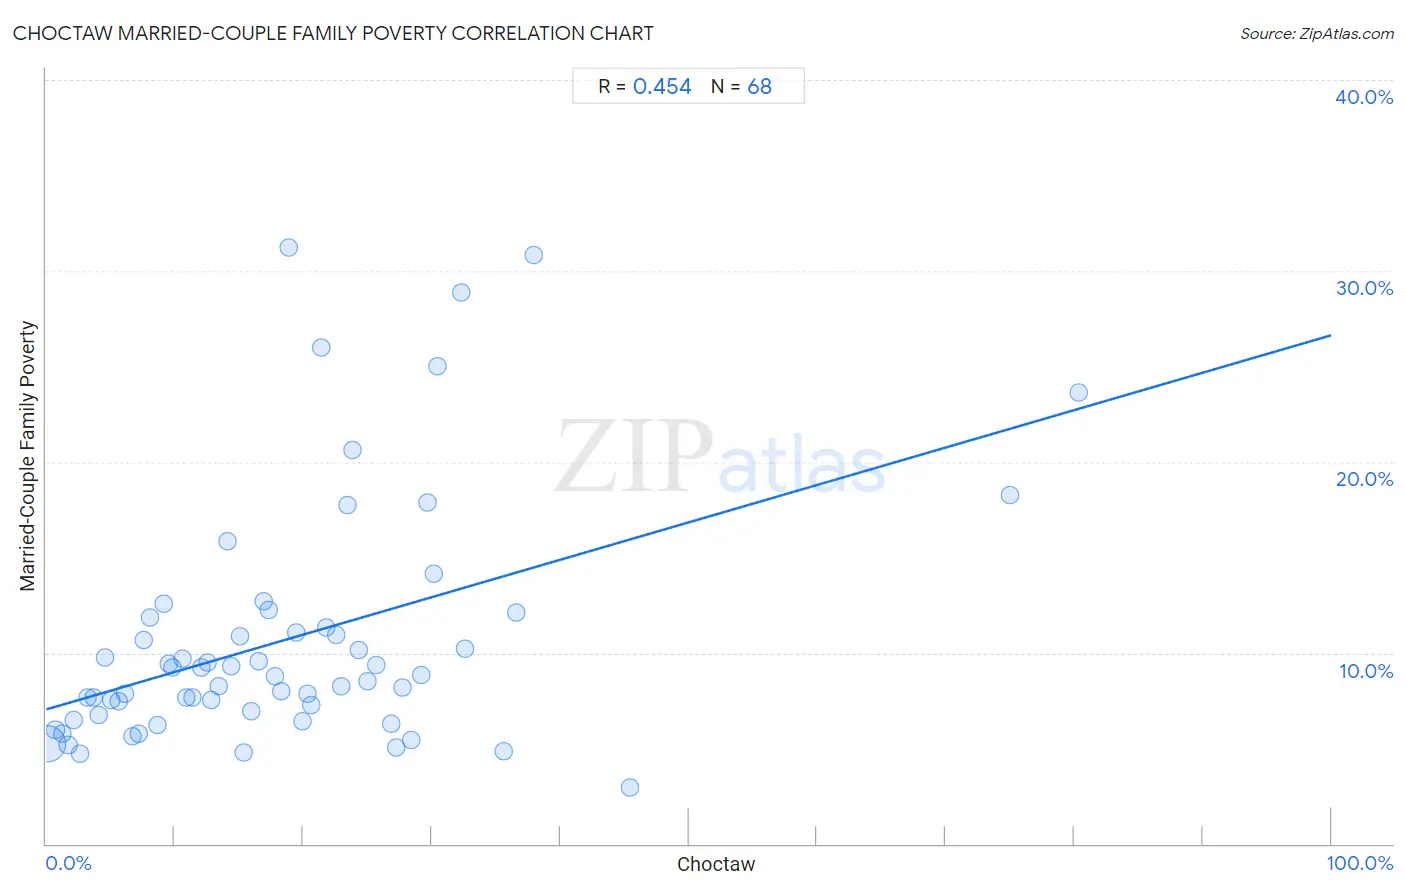
It is essential to understand that the correlation between the percentage of Choctaw and poverty level among married-couple families does not imply a direct cause-and-effect relationship. It remains uncertain whether the presence of Choctaw influences an upward or downward trend in the level of poverty level among married-couple families within an area, or if Choctaw simply ended up residing in those areas with higher or lower levels of poverty level among married-couple families due to other factors.
Demographics Similar to Choctaw by Married-Couple Family Poverty
In terms of married-couple family poverty, the demographic groups most similar to Choctaw are Barbadian (6.3%, a difference of 0.16%), Colville (6.3%, a difference of 0.21%), Yaqui (6.3%, a difference of 0.45%), Indonesian (6.3%, a difference of 0.59%), and Trinidadian and Tobagonian (6.2%, a difference of 0.99%).
| Demographics | Rating | Rank | Married-Couple Family Poverty |
| Alaska Natives | 0.2 /100 | #268 | Tragic 6.2% |
| Immigrants from West Indies | 0.1 /100 | #269 | Tragic 6.2% |
| Immigrants from Jamaica | 0.1 /100 | #270 | Tragic 6.2% |
| Immigrants from Bahamas | 0.1 /100 | #271 | Tragic 6.2% |
| Trinidadians and Tobagonians | 0.1 /100 | #272 | Tragic 6.2% |
| Colville | 0.1 /100 | #273 | Tragic 6.3% |
| Barbadians | 0.1 /100 | #274 | Tragic 6.3% |
| Choctaw | 0.1 /100 | #275 | Tragic 6.3% |
| Yaqui | 0.1 /100 | #276 | Tragic 6.3% |
| Indonesians | 0.1 /100 | #277 | Tragic 6.3% |
| Immigrants from Trinidad and Tobago | 0.1 /100 | #278 | Tragic 6.4% |
| Houma | 0.0 /100 | #279 | Tragic 6.4% |
| West Indians | 0.0 /100 | #280 | Tragic 6.4% |
| Mexican American Indians | 0.0 /100 | #281 | Tragic 6.4% |
| Seminole | 0.0 /100 | #282 | Tragic 6.4% |
Choctaw Married-Couple Family Poverty Correlation Summary
| Measurement | Choctaw Data | Married-Couple Family Poverty Data |
| Minimum | 0.081% | 3.0% |
| Maximum | 80.4% | 31.2% |
| Range | 80.3% | 28.3% |
| Mean | 18.7% | 10.7% |
| Median | 16.7% | 8.8% |
| Interquartile 25% (IQ1) | 8.4% | 6.8% |
| Interquartile 75% (IQ3) | 25.3% | 11.6% |
| Interquartile Range (IQR) | 17.0% | 4.8% |
| Standard Deviation (Sample) | 14.7% | 6.4% |
| Standard Deviation (Population) | 14.6% | 6.3% |
Correlation Details
| Choctaw Percentile | Sample Size | Married-Couple Family Poverty |
[ 0.0% - 0.5% ] 0.081% | 255,517,315 | 5.2% |
[ 0.5% - 1.0% ] 0.70% | 6,324,063 | 5.9% |
[ 1.0% - 1.5% ] 1.22% | 2,958,109 | 5.8% |
[ 1.5% - 2.0% ] 1.70% | 1,647,376 | 5.2% |
[ 2.0% - 2.5% ] 2.17% | 550,085 | 6.5% |
[ 2.5% - 3.0% ] 2.59% | 406,627 | 4.7% |
[ 3.0% - 3.5% ] 3.18% | 210,100 | 7.7% |
[ 3.5% - 4.0% ] 3.67% | 155,412 | 7.6% |
[ 4.0% - 4.5% ] 4.07% | 100,487 | 6.8% |
[ 4.5% - 5.0% ] 4.55% | 41,770 | 9.8% |
[ 5.0% - 5.5% ] 5.10% | 41,567 | 7.5% |
[ 5.5% - 6.0% ] 5.61% | 33,881 | 7.5% |
[ 6.0% - 6.5% ] 6.12% | 22,232 | 7.8% |
[ 6.5% - 7.0% ] 6.70% | 95,270 | 5.6% |
[ 7.0% - 7.5% ] 7.19% | 39,688 | 5.8% |
[ 7.5% - 8.0% ] 7.59% | 23,809 | 10.7% |
[ 8.0% - 8.5% ] 8.08% | 13,533 | 11.9% |
[ 8.5% - 9.0% ] 8.63% | 23,571 | 6.2% |
[ 9.0% - 9.5% ] 9.17% | 3,524 | 12.6% |
[ 9.5% - 10.0% ] 9.55% | 8,640 | 9.5% |
[ 9.5% - 10.0% ] 9.87% | 28,265 | 9.2% |
[ 10.5% - 11.0% ] 10.58% | 13,048 | 9.7% |
[ 10.5% - 11.0% ] 10.94% | 4,316 | 7.7% |
[ 11.0% - 11.5% ] 11.40% | 12,188 | 7.7% |
[ 12.0% - 12.5% ] 12.09% | 65,837 | 9.2% |
[ 12.5% - 13.0% ] 12.57% | 7,541 | 9.5% |
[ 12.5% - 13.0% ] 12.87% | 4,826 | 7.5% |
[ 13.0% - 13.5% ] 13.38% | 4,453 | 8.2% |
[ 14.0% - 14.5% ] 14.08% | 6,320 | 15.9% |
[ 14.0% - 14.5% ] 14.38% | 29,772 | 9.3% |
[ 15.0% - 15.5% ] 15.06% | 24,629 | 10.9% |
[ 15.0% - 15.5% ] 15.36% | 1,413 | 4.8% |
[ 15.5% - 16.0% ] 15.97% | 3,669 | 6.9% |
[ 16.5% - 17.0% ] 16.55% | 17,799 | 9.6% |
[ 16.5% - 17.0% ] 16.89% | 14,478 | 12.7% |
[ 17.0% - 17.5% ] 17.35% | 7,872 | 12.2% |
[ 17.5% - 18.0% ] 17.78% | 9,509 | 8.7% |
[ 18.0% - 18.5% ] 18.28% | 9,031 | 8.0% |
[ 18.5% - 19.0% ] 18.88% | 143 | 31.2% |
[ 19.0% - 19.5% ] 19.45% | 45,019 | 11.0% |
[ 19.5% - 20.0% ] 19.93% | 3,869 | 6.4% |
[ 20.0% - 20.5% ] 20.36% | 7,885 | 7.9% |
[ 20.5% - 21.0% ] 20.65% | 3,002 | 7.3% |
[ 21.0% - 21.5% ] 21.44% | 1,208 | 26.0% |
[ 21.5% - 22.0% ] 21.75% | 10,823 | 11.4% |
[ 22.5% - 23.0% ] 22.52% | 666 | 10.9% |
[ 22.5% - 23.0% ] 22.95% | 4,021 | 8.2% |
[ 23.0% - 23.5% ] 23.41% | 1,798 | 17.8% |
[ 23.5% - 24.0% ] 23.88% | 356 | 20.6% |
[ 24.0% - 24.5% ] 24.32% | 2,315 | 10.1% |
[ 25.0% - 25.5% ] 25.01% | 3,327 | 8.5% |
[ 25.5% - 26.0% ] 25.68% | 296 | 9.4% |
[ 26.5% - 27.0% ] 26.83% | 2,602 | 6.3% |
[ 27.0% - 27.5% ] 27.24% | 1,799 | 5.0% |
[ 27.5% - 28.0% ] 27.76% | 1,974 | 8.2% |
[ 28.0% - 28.5% ] 28.36% | 871 | 5.4% |
[ 29.0% - 29.5% ] 29.15% | 1,187 | 8.8% |
[ 29.5% - 30.0% ] 29.70% | 101 | 17.9% |
[ 30.0% - 30.5% ] 30.18% | 1,196 | 14.1% |
[ 30.0% - 30.5% ] 30.43% | 46 | 25.0% |
[ 32.0% - 32.5% ] 32.32% | 328 | 28.9% |
[ 32.5% - 33.0% ] 32.56% | 476 | 10.2% |
[ 35.5% - 36.0% ] 35.58% | 579 | 4.8% |
[ 36.5% - 37.0% ] 36.54% | 156 | 12.1% |
[ 37.5% - 38.0% ] 37.94% | 282 | 30.9% |
[ 45.0% - 45.5% ] 45.40% | 1,240 | 3.0% |
[ 75.0% - 75.5% ] 75.03% | 4,298 | 18.3% |
[ 80.0% - 80.5% ] 80.35% | 514 | 23.6% |