Choctaw 4 or more Vehicles in Household
COMPARE
Choctaw
Select to Compare
4 or more Vehicles in Household
Choctaw 4 or more Vehicles in Household
7.8%
4+ VEHICLES AVAILABLE
100.0/ 100
METRIC RATING
45th/ 347
METRIC RANK
Choctaw 4 or more Vehicles in Household Correlation Chart
The statistical analysis conducted on geographies consisting of 269,154,664 people shows a poor positive correlation between the proportion of Choctaw and percentage of households with 4 or more vehicles available in the United States with a correlation coefficient (R) of 0.126 and weighted average of 7.8%. On average, for every 1% (one percent) increase in Choctaw within a typical geography, there is an increase of 0.031% in percentage of households with 4 or more vehicles available.
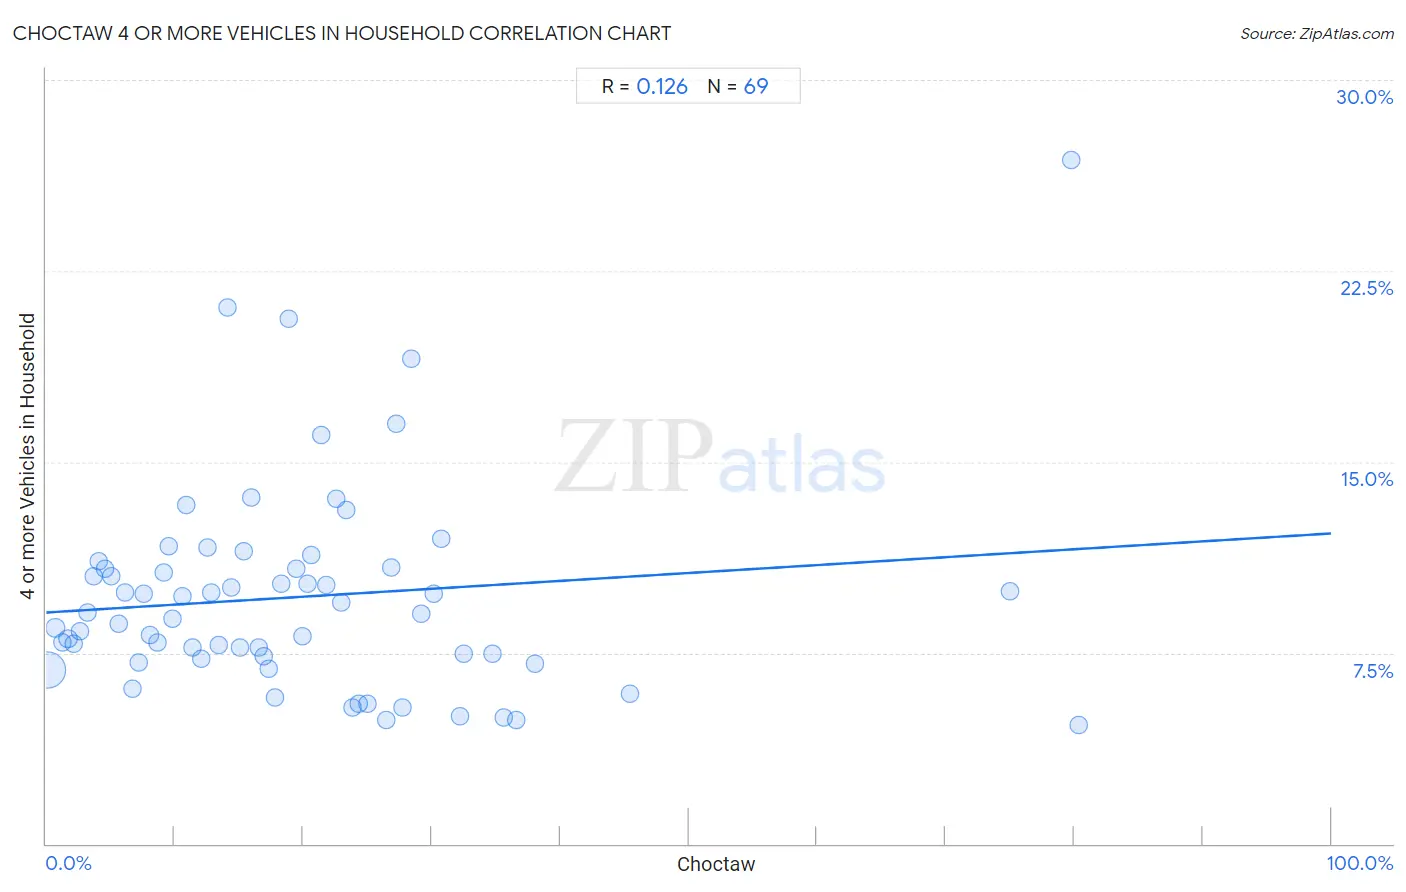
It is essential to understand that the correlation between the percentage of Choctaw and percentage of households with 4 or more vehicles available does not imply a direct cause-and-effect relationship. It remains uncertain whether the presence of Choctaw influences an upward or downward trend in the level of percentage of households with 4 or more vehicles available within an area, or if Choctaw simply ended up residing in those areas with higher or lower levels of percentage of households with 4 or more vehicles available due to other factors.
Demographics Similar to Choctaw by 4 or more Vehicles in Household
In terms of 4 or more vehicles in household, the demographic groups most similar to Choctaw are Bhutanese (7.8%, a difference of 0.050%), Crow (7.8%, a difference of 0.17%), Fijian (7.8%, a difference of 0.31%), Osage (7.8%, a difference of 0.33%), and Salvadoran (7.8%, a difference of 0.43%).
| Demographics | Rating | Rank | 4 or more Vehicles in Household |
| Sioux | 100.0 /100 | #38 | Exceptional 8.0% |
| Spanish Americans | 100.0 /100 | #39 | Exceptional 8.0% |
| Spanish | 100.0 /100 | #40 | Exceptional 7.9% |
| Pima | 100.0 /100 | #41 | Exceptional 7.9% |
| Salvadorans | 100.0 /100 | #42 | Exceptional 7.8% |
| Fijians | 100.0 /100 | #43 | Exceptional 7.8% |
| Bhutanese | 100.0 /100 | #44 | Exceptional 7.8% |
| Choctaw | 100.0 /100 | #45 | Exceptional 7.8% |
| Crow | 100.0 /100 | #46 | Exceptional 7.8% |
| Osage | 100.0 /100 | #47 | Exceptional 7.8% |
| Swiss | 100.0 /100 | #48 | Exceptional 7.8% |
| Cherokee | 100.0 /100 | #49 | Exceptional 7.7% |
| Immigrants from El Salvador | 100.0 /100 | #50 | Exceptional 7.7% |
| Immigrants from Laos | 100.0 /100 | #51 | Exceptional 7.7% |
| Japanese | 100.0 /100 | #52 | Exceptional 7.7% |
Choctaw 4 or more Vehicles in Household Correlation Summary
| Measurement | Choctaw Data | 4 or more Vehicles in Household Data |
| Minimum | 0.081% | 4.7% |
| Maximum | 80.4% | 26.9% |
| Range | 80.3% | 22.2% |
| Mean | 19.6% | 9.7% |
| Median | 16.9% | 9.0% |
| Interquartile 25% (IQ1) | 8.3% | 7.3% |
| Interquartile 75% (IQ3) | 26.6% | 10.8% |
| Interquartile Range (IQR) | 18.3% | 3.5% |
| Standard Deviation (Sample) | 16.4% | 4.1% |
| Standard Deviation (Population) | 16.3% | 4.0% |
Correlation Details
| Choctaw Percentile | Sample Size | 4 or more Vehicles in Household |
[ 0.0% - 0.5% ] 0.081% | 255,762,450 | 6.8% |
[ 0.5% - 1.0% ] 0.70% | 6,472,062 | 8.5% |
[ 1.0% - 1.5% ] 1.22% | 3,033,723 | 7.9% |
[ 1.5% - 2.0% ] 1.70% | 1,677,849 | 8.0% |
[ 2.0% - 2.5% ] 2.17% | 571,750 | 7.8% |
[ 2.5% - 3.0% ] 2.60% | 417,994 | 8.3% |
[ 3.0% - 3.5% ] 3.18% | 216,952 | 9.1% |
[ 3.5% - 4.0% ] 3.67% | 156,638 | 10.5% |
[ 4.0% - 4.5% ] 4.08% | 103,797 | 11.1% |
[ 4.5% - 5.0% ] 4.56% | 45,521 | 10.8% |
[ 5.0% - 5.5% ] 5.10% | 43,912 | 10.5% |
[ 5.5% - 6.0% ] 5.62% | 34,703 | 8.7% |
[ 6.0% - 6.5% ] 6.12% | 20,000 | 9.9% |
[ 6.5% - 7.0% ] 6.70% | 96,554 | 6.1% |
[ 7.0% - 7.5% ] 7.18% | 42,645 | 7.1% |
[ 7.5% - 8.0% ] 7.59% | 24,160 | 9.8% |
[ 8.0% - 8.5% ] 8.08% | 13,583 | 8.2% |
[ 8.5% - 9.0% ] 8.61% | 26,829 | 7.9% |
[ 9.0% - 9.5% ] 9.16% | 3,787 | 10.7% |
[ 9.5% - 10.0% ] 9.54% | 9,892 | 11.7% |
[ 9.5% - 10.0% ] 9.87% | 28,495 | 8.8% |
[ 10.5% - 11.0% ] 10.58% | 13,724 | 9.7% |
[ 10.5% - 11.0% ] 10.93% | 4,472 | 13.3% |
[ 11.0% - 11.5% ] 11.41% | 16,110 | 7.7% |
[ 12.0% - 12.5% ] 12.09% | 64,779 | 7.3% |
[ 12.5% - 13.0% ] 12.56% | 10,541 | 11.6% |
[ 12.5% - 13.0% ] 12.86% | 4,711 | 9.9% |
[ 13.0% - 13.5% ] 13.41% | 5,728 | 7.8% |
[ 14.0% - 14.5% ] 14.09% | 6,205 | 21.1% |
[ 14.0% - 14.5% ] 14.38% | 29,800 | 10.0% |
[ 15.0% - 15.5% ] 15.06% | 25,206 | 7.7% |
[ 15.0% - 15.5% ] 15.37% | 1,574 | 11.5% |
[ 15.5% - 16.0% ] 15.96% | 4,475 | 13.6% |
[ 16.5% - 17.0% ] 16.55% | 18,037 | 7.7% |
[ 16.5% - 17.0% ] 16.89% | 14,688 | 7.4% |
[ 17.0% - 17.5% ] 17.36% | 7,640 | 6.9% |
[ 17.5% - 18.0% ] 17.78% | 9,509 | 5.7% |
[ 18.0% - 18.5% ] 18.28% | 9,031 | 10.2% |
[ 18.5% - 19.0% ] 18.83% | 531 | 20.6% |
[ 19.0% - 19.5% ] 19.45% | 45,587 | 10.8% |
[ 19.5% - 20.0% ] 19.93% | 3,869 | 8.2% |
[ 20.0% - 20.5% ] 20.36% | 7,885 | 10.2% |
[ 20.5% - 21.0% ] 20.65% | 3,002 | 11.3% |
[ 21.0% - 21.5% ] 21.45% | 1,478 | 16.1% |
[ 21.5% - 22.0% ] 21.75% | 11,047 | 10.2% |
[ 22.5% - 23.0% ] 22.52% | 746 | 13.5% |
[ 22.5% - 23.0% ] 22.95% | 4,021 | 9.5% |
[ 23.0% - 23.5% ] 23.37% | 2,045 | 13.1% |
[ 23.5% - 24.0% ] 23.84% | 453 | 5.4% |
[ 24.0% - 24.5% ] 24.32% | 2,315 | 5.5% |
[ 25.0% - 25.5% ] 25.01% | 3,327 | 5.5% |
[ 26.0% - 26.5% ] 26.46% | 223 | 4.9% |
[ 26.5% - 27.0% ] 26.83% | 2,602 | 10.8% |
[ 27.0% - 27.5% ] 27.23% | 1,998 | 16.5% |
[ 27.5% - 28.0% ] 27.75% | 2,115 | 5.4% |
[ 28.0% - 28.5% ] 28.36% | 871 | 19.0% |
[ 29.0% - 29.5% ] 29.15% | 1,187 | 9.0% |
[ 30.0% - 30.5% ] 30.18% | 1,196 | 9.8% |
[ 30.5% - 31.0% ] 30.77% | 234 | 12.0% |
[ 32.0% - 32.5% ] 32.21% | 447 | 5.0% |
[ 32.0% - 32.5% ] 32.50% | 240 | 7.5% |
[ 34.5% - 35.0% ] 34.75% | 141 | 7.5% |
[ 35.5% - 36.0% ] 35.58% | 579 | 5.0% |
[ 36.5% - 37.0% ] 36.54% | 156 | 4.8% |
[ 38.0% - 38.5% ] 38.07% | 218 | 7.1% |
[ 45.0% - 45.5% ] 45.40% | 1,240 | 5.9% |
[ 75.0% - 75.5% ] 75.03% | 4,298 | 9.9% |
[ 79.5% - 80.0% ] 79.76% | 573 | 26.9% |
[ 80.0% - 80.5% ] 80.35% | 514 | 4.7% |