Choctaw Self-Care Disability
COMPARE
Choctaw
Select to Compare
Self-Care Disability
Choctaw Self-Care Disability
3.0%
SELF-CARE DISABILITY
0.0/ 100
METRIC RATING
337th/ 347
METRIC RANK
Choctaw Self-Care Disability Correlation Chart
The statistical analysis conducted on geographies consisting of 269,470,857 people shows a poor positive correlation between the proportion of Choctaw and percentage of population with self-care disability in the United States with a correlation coefficient (R) of 0.151 and weighted average of 3.0%. On average, for every 1% (one percent) increase in Choctaw within a typical geography, there is an increase of 0.023% in percentage of population with self-care disability.
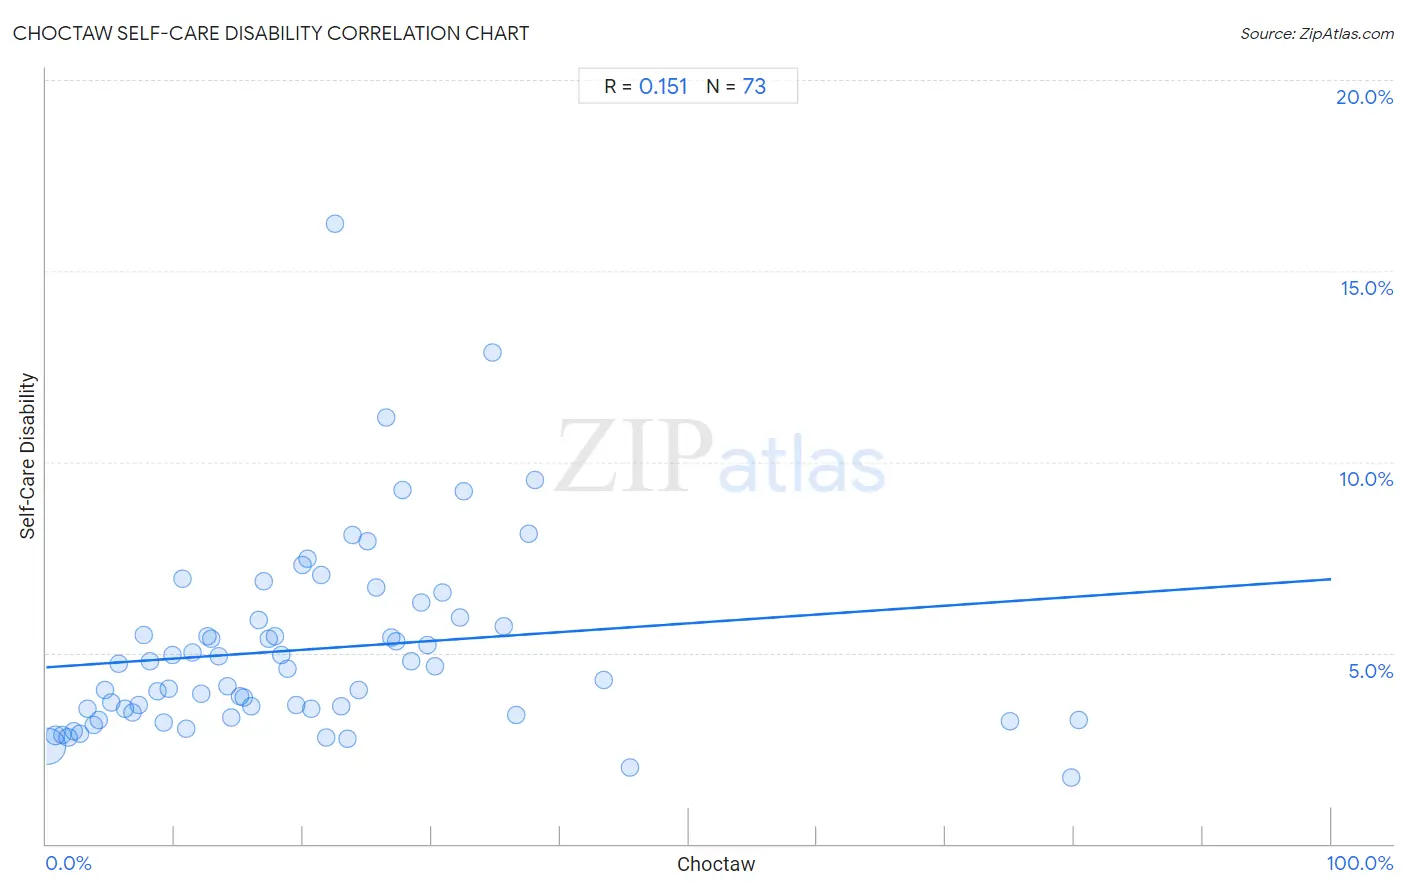
It is essential to understand that the correlation between the percentage of Choctaw and percentage of population with self-care disability does not imply a direct cause-and-effect relationship. It remains uncertain whether the presence of Choctaw influences an upward or downward trend in the level of percentage of population with self-care disability within an area, or if Choctaw simply ended up residing in those areas with higher or lower levels of percentage of population with self-care disability due to other factors.
Demographics Similar to Choctaw by Self-Care Disability
In terms of self-care disability, the demographic groups most similar to Choctaw are Cape Verdean (3.0%, a difference of 0.31%), Immigrants from Dominican Republic (3.0%, a difference of 0.69%), Immigrants from Cabo Verde (3.1%, a difference of 1.0%), Immigrants from Yemen (3.0%, a difference of 1.1%), and Immigrants from the Azores (3.0%, a difference of 1.2%).
| Demographics | Rating | Rank | Self-Care Disability |
| Nepalese | 0.0 /100 | #330 | Tragic 3.0% |
| Lumbee | 0.0 /100 | #331 | Tragic 3.0% |
| Kiowa | 0.0 /100 | #332 | Tragic 3.0% |
| Dutch West Indians | 0.0 /100 | #333 | Tragic 3.0% |
| Houma | 0.0 /100 | #334 | Tragic 3.0% |
| Immigrants from the Azores | 0.0 /100 | #335 | Tragic 3.0% |
| Immigrants from Yemen | 0.0 /100 | #336 | Tragic 3.0% |
| Choctaw | 0.0 /100 | #337 | Tragic 3.0% |
| Cape Verdeans | 0.0 /100 | #338 | Tragic 3.0% |
| Immigrants from Dominican Republic | 0.0 /100 | #339 | Tragic 3.0% |
| Immigrants from Cabo Verde | 0.0 /100 | #340 | Tragic 3.1% |
| Dominicans | 0.0 /100 | #341 | Tragic 3.1% |
| Colville | 0.0 /100 | #342 | Tragic 3.1% |
| Tohono O'odham | 0.0 /100 | #343 | Tragic 3.1% |
| Pueblo | 0.0 /100 | #344 | Tragic 3.3% |
Choctaw Self-Care Disability Correlation Summary
| Measurement | Choctaw Data | Self-Care Disability Data |
| Minimum | 0.081% | 1.7% |
| Maximum | 80.4% | 16.2% |
| Range | 80.3% | 14.5% |
| Mean | 20.4% | 5.1% |
| Median | 17.8% | 4.6% |
| Interquartile 25% (IQ1) | 8.9% | 3.4% |
| Interquartile 75% (IQ3) | 27.5% | 5.9% |
| Interquartile Range (IQR) | 18.6% | 2.5% |
| Standard Deviation (Sample) | 16.4% | 2.5% |
| Standard Deviation (Population) | 16.3% | 2.5% |
Correlation Details
| Choctaw Percentile | Sample Size | Self-Care Disability |
[ 0.0% - 0.5% ] 0.081% | 256,084,061 | 2.5% |
[ 0.5% - 1.0% ] 0.70% | 6,470,156 | 2.8% |
[ 1.0% - 1.5% ] 1.22% | 3,030,987 | 2.8% |
[ 1.5% - 2.0% ] 1.70% | 1,676,241 | 2.8% |
[ 2.0% - 2.5% ] 2.17% | 570,715 | 2.9% |
[ 2.5% - 3.0% ] 2.60% | 421,130 | 2.9% |
[ 3.0% - 3.5% ] 3.18% | 215,977 | 3.5% |
[ 3.5% - 4.0% ] 3.67% | 156,585 | 3.1% |
[ 4.0% - 4.5% ] 4.08% | 103,979 | 3.3% |
[ 4.5% - 5.0% ] 4.55% | 43,257 | 4.0% |
[ 5.0% - 5.5% ] 5.10% | 43,597 | 3.7% |
[ 5.5% - 6.0% ] 5.61% | 34,357 | 4.7% |
[ 6.0% - 6.5% ] 6.12% | 22,633 | 3.5% |
[ 6.5% - 7.0% ] 6.70% | 96,236 | 3.4% |
[ 7.0% - 7.5% ] 7.18% | 42,461 | 3.6% |
[ 7.5% - 8.0% ] 7.59% | 24,079 | 5.5% |
[ 8.0% - 8.5% ] 8.08% | 13,583 | 4.8% |
[ 8.5% - 9.0% ] 8.61% | 26,481 | 4.0% |
[ 9.0% - 9.5% ] 9.14% | 4,112 | 3.2% |
[ 9.5% - 10.0% ] 9.55% | 9,897 | 4.1% |
[ 9.5% - 10.0% ] 9.87% | 28,765 | 5.0% |
[ 10.5% - 11.0% ] 10.58% | 13,676 | 6.9% |
[ 10.5% - 11.0% ] 10.93% | 4,472 | 3.0% |
[ 11.0% - 11.5% ] 11.41% | 16,242 | 5.0% |
[ 12.0% - 12.5% ] 12.09% | 65,954 | 3.9% |
[ 12.5% - 13.0% ] 12.58% | 11,494 | 5.4% |
[ 12.5% - 13.0% ] 12.84% | 4,402 | 5.4% |
[ 13.0% - 13.5% ] 13.40% | 5,000 | 4.9% |
[ 14.0% - 14.5% ] 14.09% | 6,205 | 4.1% |
[ 14.0% - 14.5% ] 14.38% | 29,855 | 3.3% |
[ 15.0% - 15.5% ] 15.06% | 24,629 | 3.9% |
[ 15.0% - 15.5% ] 15.36% | 1,458 | 3.8% |
[ 15.5% - 16.0% ] 15.96% | 4,103 | 3.6% |
[ 16.5% - 17.0% ] 16.55% | 17,945 | 5.9% |
[ 16.5% - 17.0% ] 16.89% | 14,782 | 6.9% |
[ 17.0% - 17.5% ] 17.36% | 7,640 | 5.4% |
[ 17.5% - 18.0% ] 17.78% | 9,509 | 5.4% |
[ 18.0% - 18.5% ] 18.28% | 9,031 | 4.9% |
[ 18.5% - 19.0% ] 18.81% | 489 | 4.6% |
[ 19.0% - 19.5% ] 19.45% | 45,462 | 3.6% |
[ 19.5% - 20.0% ] 19.93% | 3,869 | 7.3% |
[ 20.0% - 20.5% ] 20.36% | 7,885 | 7.4% |
[ 20.5% - 21.0% ] 20.65% | 3,002 | 3.6% |
[ 21.0% - 21.5% ] 21.44% | 1,208 | 7.0% |
[ 21.5% - 22.0% ] 21.75% | 10,951 | 2.8% |
[ 22.0% - 22.5% ] 22.50% | 840 | 16.2% |
[ 22.5% - 23.0% ] 22.95% | 4,021 | 3.6% |
[ 23.0% - 23.5% ] 23.41% | 1,798 | 2.8% |
[ 23.5% - 24.0% ] 23.84% | 453 | 8.1% |
[ 24.0% - 24.5% ] 24.32% | 2,315 | 4.0% |
[ 25.0% - 25.5% ] 25.01% | 3,327 | 7.9% |
[ 25.5% - 26.0% ] 25.68% | 296 | 6.7% |
[ 26.0% - 26.5% ] 26.46% | 223 | 11.2% |
[ 26.5% - 27.0% ] 26.83% | 2,602 | 5.4% |
[ 27.0% - 27.5% ] 27.23% | 1,998 | 5.3% |
[ 27.5% - 28.0% ] 27.76% | 1,974 | 9.3% |
[ 28.0% - 28.5% ] 28.36% | 871 | 4.8% |
[ 29.0% - 29.5% ] 29.15% | 1,187 | 6.3% |
[ 29.5% - 30.0% ] 29.70% | 101 | 5.2% |
[ 30.0% - 30.5% ] 30.20% | 1,076 | 4.7% |
[ 30.5% - 31.0% ] 30.85% | 188 | 6.6% |
[ 32.0% - 32.5% ] 32.21% | 447 | 5.9% |
[ 32.5% - 33.0% ] 32.53% | 621 | 9.2% |
[ 34.5% - 35.0% ] 34.75% | 141 | 12.9% |
[ 35.5% - 36.0% ] 35.58% | 579 | 5.7% |
[ 36.5% - 37.0% ] 36.54% | 156 | 3.4% |
[ 37.0% - 37.5% ] 37.50% | 40 | 8.1% |
[ 37.5% - 38.0% ] 38.00% | 350 | 9.5% |
[ 43.0% - 43.5% ] 43.42% | 76 | 4.3% |
[ 45.0% - 45.5% ] 45.40% | 1,240 | 2.0% |
[ 75.0% - 75.5% ] 75.03% | 4,298 | 3.2% |
[ 79.5% - 80.0% ] 79.76% | 573 | 1.7% |
[ 80.0% - 80.5% ] 80.35% | 514 | 3.2% |