Chilean College, 1 year or more

COMPARE

Chilean
Race
Ancestry
AfghanAfricanAlaska NativeAlaskan AthabascanAlbanianAleutAlsatianAmericanApacheArabArapahoArgentineanArmenianAssyrian/Chaldean/SyriacAustralianAustrianBahamianBangladeshiBarbadianBasqueBelgianBelizeanBermudanBhutaneseBlackfeetBolivianBrazilianBritishBritish West IndianBulgarianBurmeseCajunCambodianCanadianCape VerdeanCarpatho RusynCelticCentral AmericanCentral American IndianCherokeeCheyenneChickasawChileanChineseChippewaChoctawColombianColvilleComancheCosta RicanCreeCreekCroatianCrowCubanCypriotCzechCzechoslovakianDanishDelawareDominicanDutchDutch West IndianEastern EuropeanEcuadorianEgyptianEnglishEstonianEthiopianEuropeanFijianFilipinoFinnishFrenchFrench American IndianFrench CanadianGermanGerman RussianGhanaianGreekGuamanian/ChamorroGuatemalanGuyaneseHaitianHmongHonduranHopiHoumaHungarianIcelanderIndian (Asian)IndonesianInupiatIranianIraqiIrishIroquoisIsraeliItalianJamaicanJapaneseJordanianKenyanKiowaKoreanLaotianLatvianLebaneseLiberianLithuanianLumbeeLuxembourgerMacedonianMalaysianMalteseMarshalleseMenomineeMexicanMexican American IndianMongolianMoroccanNative HawaiianNavajoNepaleseNew ZealanderNicaraguanNigerianNorthern EuropeanNorwegianOkinawanOsageOttawaPaiutePakistaniPalestinianPanamanianParaguayanPennsylvania GermanPeruvianPimaPolishPortuguesePotawatomiPuebloPuerto RicanPuget Sound SalishRomanianRussianSalvadoranSamoanScandinavianScotch-IrishScottishSeminoleSenegaleseSerbianShoshoneSierra LeoneanSiouxSlavicSlovakSloveneSomaliSouth AfricanSouth AmericanSouth American IndianSoviet UnionSpaniardSpanishSpanish AmericanSpanish American IndianSri LankanSubsaharan AfricanSudaneseSwedishSwissSyrianTaiwaneseThaiTlingit-HaidaTohono O'OdhamTonganTrinidadian and TobagonianTsimshianTurkishU.S. Virgin IslanderUgandanUkrainianUruguayanUteVenezuelanVietnameseWelshWest IndianYakamaYaquiYugoslavianYumanYup'ikZimbabwean
Immigration
NonimmigrantsImmigrantsAfghanistanAfricaAlbaniaArgentinaArmeniaAsiaAustraliaAustriaBahamasBangladeshBarbadosBelarusBelgiumBelizeBoliviaBosnia and HerzegovinaBrazilBulgariaBurma/MyanmarCabo VerdeCambodiaCameroonCanadaCaribbeanCentral AmericaChileChinaColombiaCongoCosta RicaCroatiaCubaCzechoslovakiaDenmarkDominicaDominican RepublicEastern AfricaEastern AsiaEastern EuropeEcuadorEgyptEl SalvadorEnglandEritreaEthiopiaEuropeFijiFranceGermanyGhanaGreeceGrenadaGuatemalaGuyanaHaitiHondurasHong KongHungaryIndiaIndonesiaIranIraqIrelandIsraelItalyJamaicaJapanJordanKazakhstanKenyaKoreaKuwaitLaosLatin AmericaLatviaLebanonLiberiaLithuaniaMalaysiaMexicoMicronesiaMiddle AfricaMoldovaMoroccoNepalNetherlandsNicaraguaNigeriaNorth AmericaNorth MacedoniaNorthern AfricaNorthern EuropeNorwayOceaniaPakistanPanamaPeruPhilippinesPolandPortugalRomaniaRussiaSaudi ArabiaScotlandSenegalSerbiaSierra LeoneSingaporeSomaliaSouth AfricaSouth AmericaSouth Central AsiaSouth Eastern AsiaSouthern EuropeSpainSri LankaSt. Vincent and the GrenadinesSudanSwedenSwitzerlandSyriaTaiwanThailandTrinidad and TobagoTurkeyUgandaUkraineUruguayUzbekistanVenezuelaVietnamWest IndiesWestern AfricaWestern AsiaWestern EuropeYemenZaireZimbabweAzores
Select to Compare
Race
Ancestry
AfghanAfricanAlaska NativeAlaskan AthabascanAlbanianAleutAlsatianAmericanApacheArabArapahoArgentineanArmenianAssyrian/Chaldean/SyriacAustralianAustrianBahamianBangladeshiBarbadianBasqueBelgianBelizeanBermudanBhutaneseBlackfeetBolivianBrazilianBritishBritish West IndianBulgarianBurmeseCajunCambodianCanadianCape VerdeanCarpatho RusynCelticCentral AmericanCentral American IndianCherokeeCheyenneChickasawChineseChippewaChoctawColombianColvilleComancheCosta RicanCreeCreekCroatianCrowCubanCypriotCzechCzechoslovakianDanishDelawareDominicanDutchDutch West IndianEastern EuropeanEcuadorianEgyptianEnglishEstonianEthiopianEuropeanFijianFilipinoFinnishFrenchFrench American IndianFrench CanadianGermanGerman RussianGhanaianGreekGuamanian/ChamorroGuatemalanGuyaneseHaitianHmongHonduranHopiHoumaHungarianIcelanderIndian (Asian)IndonesianInupiatIranianIraqiIrishIroquoisIsraeliItalianJamaicanJapaneseJordanianKenyanKiowaKoreanLaotianLatvianLebaneseLiberianLithuanianLumbeeLuxembourgerMacedonianMalaysianMalteseMarshalleseMenomineeMexicanMexican American IndianMongolianMoroccanNative HawaiianNavajoNepaleseNew ZealanderNicaraguanNigerianNorthern EuropeanNorwegianOkinawanOsageOttawaPaiutePakistaniPalestinianPanamanianParaguayanPennsylvania GermanPeruvianPimaPolishPortuguesePotawatomiPuebloPuerto RicanPuget Sound SalishRomanianRussianSalvadoranSamoanScandinavianScotch-IrishScottishSeminoleSenegaleseSerbianShoshoneSierra LeoneanSiouxSlavicSlovakSloveneSomaliSouth AfricanSouth AmericanSouth American IndianSoviet UnionSpaniardSpanishSpanish AmericanSpanish American IndianSri LankanSubsaharan AfricanSudaneseSwedishSwissSyrianTaiwaneseThaiTlingit-HaidaTohono O'OdhamTonganTrinidadian and TobagonianTsimshianTurkishU.S. Virgin IslanderUgandanUkrainianUruguayanUteVenezuelanVietnameseWelshWest IndianYakamaYaquiYugoslavianYumanYup'ikZimbabwean
Immigration
NonimmigrantsImmigrantsAfghanistanAfricaAlbaniaArgentinaArmeniaAsiaAustraliaAustriaBahamasBangladeshBarbadosBelarusBelgiumBelizeBoliviaBosnia and HerzegovinaBrazilBulgariaBurma/MyanmarCabo VerdeCambodiaCameroonCanadaCaribbeanCentral AmericaChileChinaColombiaCongoCosta RicaCroatiaCubaCzechoslovakiaDenmarkDominicaDominican RepublicEastern AfricaEastern AsiaEastern EuropeEcuadorEgyptEl SalvadorEnglandEritreaEthiopiaEuropeFijiFranceGermanyGhanaGreeceGrenadaGuatemalaGuyanaHaitiHondurasHong KongHungaryIndiaIndonesiaIranIraqIrelandIsraelItalyJamaicaJapanJordanKazakhstanKenyaKoreaKuwaitLaosLatin AmericaLatviaLebanonLiberiaLithuaniaMalaysiaMexicoMicronesiaMiddle AfricaMoldovaMoroccoNepalNetherlandsNicaraguaNigeriaNorth AmericaNorth MacedoniaNorthern AfricaNorthern EuropeNorwayOceaniaPakistanPanamaPeruPhilippinesPolandPortugalRomaniaRussiaSaudi ArabiaScotlandSenegalSerbiaSierra LeoneSingaporeSomaliaSouth AfricaSouth AmericaSouth Central AsiaSouth Eastern AsiaSouthern EuropeSpainSri LankaSt. Vincent and the GrenadinesSudanSwedenSwitzerlandSyriaTaiwanThailandTrinidad and TobagoTurkeyUgandaUkraineUruguayUzbekistanVenezuelaVietnamWest IndiesWestern AfricaWestern AsiaWestern EuropeYemenZaireZimbabweAzores
College, 1 year or more
Income
Poverty
Unemployment
Labor Participation
Family Structure
Vehicle Availability
Education Level
Disability

Chilean College, 1 year or more
Exceptional

62.0%
COLLEGE, 1 YEAR OR MORE
96.4/ 100
METRIC RATING
104th/ 347
METRIC RANK

Chilean College, 1 year or more Correlation Chart

The statistical analysis conducted on geographies consisting of 256,684,337 people shows a poor negative correlation between the proportion of Chileans and percentage of population with at least college, 1 year or more education in the United States with a correlation coefficient (R) of -0.174 and weighted average of 62.0%. On average, for every 1% (one percent) increase in Chileans within a typical geography, there is a decrease of 0.40% in percentage of population with at least college, 1 year or more education.
Chilean College, 1 year or more
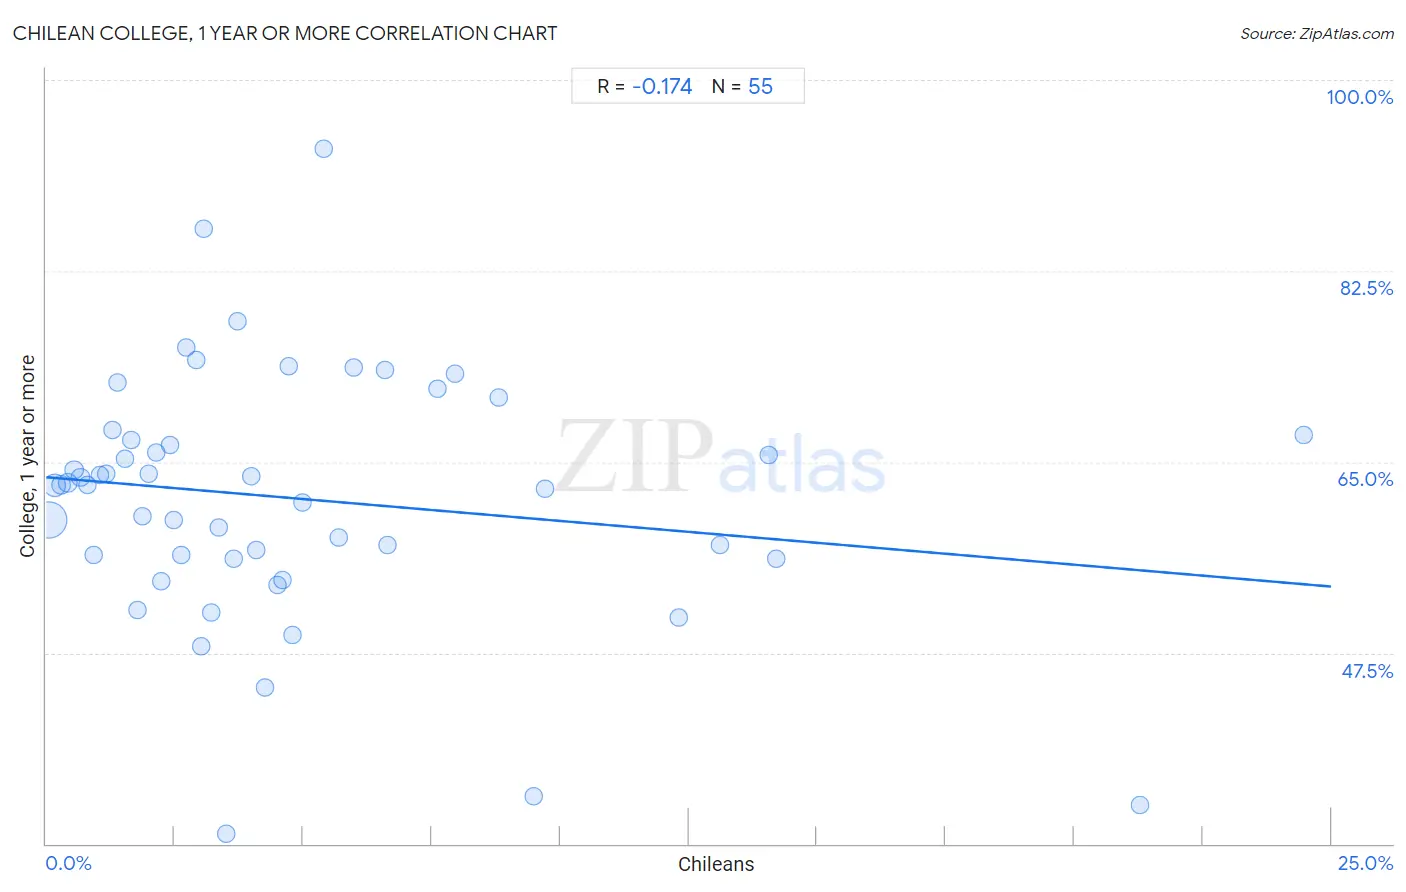
It is essential to understand that the correlation between the percentage of Chileans and percentage of population with at least college, 1 year or more education does not imply a direct cause-and-effect relationship. It remains uncertain whether the presence of Chileans influences an upward or downward trend in the level of percentage of population with at least college, 1 year or more education within an area, or if Chileans simply ended up residing in those areas with higher or lower levels of percentage of population with at least college, 1 year or more education due to other factors.

Demographics Similar to Chileans by College, 1 year or more

In terms of college, 1 year or more, the demographic groups most similar to Chileans are Afghan (62.0%, a difference of 0.010%), Immigrants from Nepal (62.0%, a difference of 0.020%), Palestinian (62.0%, a difference of 0.020%), Luxembourger (62.1%, a difference of 0.13%), and Swedish (62.1%, a difference of 0.14%).
DemographicsRating | RankCollege, 1 year or more
Jordanians
97.2
/100
|
#97
Exceptional
62.2%
Carpatho Rusyns
97.2
/100
|
#98
Exceptional
62.2%
Croatians
97.1
/100
|
#99
Exceptional
62.2%
Icelanders
96.8
/100
|
#100
Exceptional
62.1%
Swedes
96.8
/100
|
#101
Exceptional
62.1%
Luxembourgers
96.7
/100
|
#102
Exceptional
62.1%
Afghans
96.4
/100
|
#103
Exceptional
62.0%
Chileans
96.4
/100
|
#104
Exceptional
62.0%
Immigrants from Nepal
96.3
/100
|
#105
Exceptional
62.0%
Palestinians
96.3
/100
|
#106
Exceptional
62.0%
Immigrants from Ukraine
95.8
/100
|
#107
Exceptional
61.9%
Syrians
95.7
/100
|
#108
Exceptional
61.9%
Immigrants from Northern Africa
95.7
/100
|
#109
Exceptional
61.9%
Europeans
95.6
/100
|
#110
Exceptional
61.8%
Macedonians
95.6
/100
|
#111
Exceptional
61.8%

Chilean College, 1 year or more Correlation Summary

MeasurementChilean DataCollege, 1 year or more Data
Minimum0.054%30.9%
Maximum24.5%93.7%
Range24.4%62.8%
Mean4.9%61.6%
Median3.4%62.9%
Interquartile 25% (IQ1)1.7%56.2%
Interquartile 75% (IQ3)6.0%67.5%
Interquartile Range (IQR)4.3%11.3%
Standard Deviation (Sample)5.0%11.5%
Standard Deviation (Population)4.9%11.4%

Correlation Details

Chilean PercentileSample SizeCollege, 1 year or more
[
0.0%
-
0.5%
]
0.054%
182,425,02159.7%
[
0.0%
-
0.5%
]
0.17%
41,287,49462.8%
[
0.0%
-
0.5%
]
0.30%
15,259,24162.9%
[
0.0%
-
0.5%
]
0.42%
6,590,02863.1%
[
0.5%
-
1.0%
]
0.54%
3,916,16364.3%
[
0.5%
-
1.0%
]
0.66%
2,216,33663.6%
[
0.5%
-
1.0%
]
0.80%
1,585,60162.9%
[
0.5%
-
1.0%
]
0.92%
1,012,65256.5%
[
1.0%
-
1.5%
]
1.04%
672,04263.8%
[
1.0%
-
1.5%
]
1.16%
515,32763.9%
[
1.0%
-
1.5%
]
1.28%
334,37168.0%
[
1.0%
-
1.5%
]
1.40%
131,59372.2%
[
1.5%
-
2.0%
]
1.53%
93,56065.3%
[
1.5%
-
2.0%
]
1.66%
126,14267.0%
[
1.5%
-
2.0%
]
1.78%
87,57151.4%
[
1.5%
-
2.0%
]
1.88%
80,99160.1%
[
2.0%
-
2.5%
]
2.00%
35,88163.9%
[
2.0%
-
2.5%
]
2.15%
21,99265.9%
[
2.0%
-
2.5%
]
2.24%
40,47754.1%
[
2.0%
-
2.5%
]
2.40%
15,29966.6%
[
2.0%
-
2.5%
]
2.49%
10,11459.7%
[
2.5%
-
3.0%
]
2.62%
1,90756.5%
[
2.5%
-
3.0%
]
2.72%
16,41875.5%
[
2.5%
-
3.0%
]
2.93%
9,50374.3%
[
3.0%
-
3.5%
]
3.01%
19,16048.1%
[
3.0%
-
3.5%
]
3.07%
29,21186.4%
[
3.0%
-
3.5%
]
3.21%
8,10451.2%
[
3.0%
-
3.5%
]
3.35%
20,44859.0%
[
3.0%
-
3.5%
]
3.50%
2,57330.9%
[
3.5%
-
4.0%
]
3.64%
3,56756.1%
[
3.5%
-
4.0%
]
3.72%
3,03577.8%
[
3.5%
-
4.0%
]
3.98%
19,91763.7%
[
4.0%
-
4.5%
]
4.08%
29,40656.9%
[
4.0%
-
4.5%
]
4.26%
2,63144.3%
[
4.5%
-
5.0%
]
4.50%
3,62053.8%
[
4.5%
-
5.0%
]
4.60%
14,36154.1%
[
4.5%
-
5.0%
]
4.73%
3,74573.8%
[
4.5%
-
5.0%
]
4.80%
1,10449.1%
[
4.5%
-
5.0%
]
4.99%
1,02261.3%
[
5.0%
-
5.5%
]
5.40%
1,25993.7%
[
5.5%
-
6.0%
]
5.68%
3,94358.1%
[
5.5%
-
6.0%
]
5.99%
1,90473.7%
[
6.5%
-
7.0%
]
6.60%
98573.5%
[
6.5%
-
7.0%
]
6.64%
4,16957.3%
[
7.5%
-
8.0%
]
7.62%
8,45071.8%
[
7.5%
-
8.0%
]
7.95%
1,62273.1%
[
8.5%
-
9.0%
]
8.81%
7,30770.9%
[
9.0%
-
9.5%
]
9.49%
2,61234.4%
[
9.5%
-
10.0%
]
9.70%
1,73262.6%
[
12.0%
-
12.5%
]
12.30%
73250.7%
[
13.0%
-
13.5%
]
13.11%
12257.4%
[
14.0%
-
14.5%
]
14.06%
6465.6%
[
14.0%
-
14.5%
]
14.21%
95756.2%
[
21.0%
-
21.5%
]
21.27%
75733.6%
[
24.0%
-
24.5%
]
24.47%
9467.5%