Chilean Wage/Income Gap
COMPARE
Chilean
Select to Compare
Wage/Income Gap
Chilean Wage/Income Gap
26.3%
WAGE/INCOME GAP
22.3/ 100
METRIC RATING
194th/ 347
METRIC RANK
Chilean Wage/Income Gap Correlation Chart
The statistical analysis conducted on geographies consisting of 256,626,155 people shows a poor positive correlation between the proportion of Chileans and wage/income gap percentage in the United States with a correlation coefficient (R) of 0.141 and weighted average of 26.3%. On average, for every 1% (one percent) increase in Chileans within a typical geography, there is an increase of 0.49% in wage/income gap percentage.
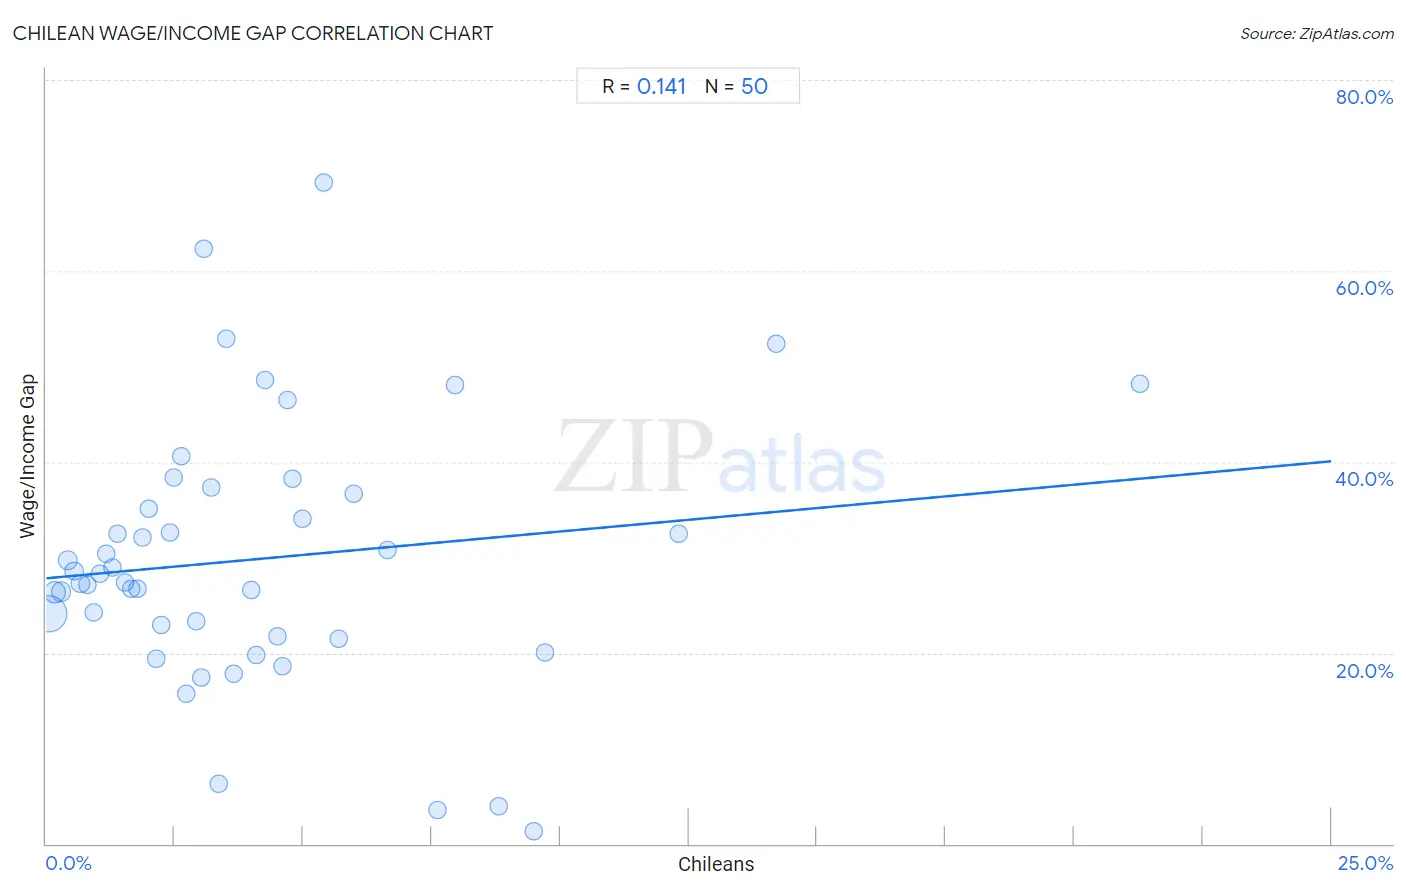
It is essential to understand that the correlation between the percentage of Chileans and wage/income gap percentage does not imply a direct cause-and-effect relationship. It remains uncertain whether the presence of Chileans influences an upward or downward trend in the level of wage/income gap percentage within an area, or if Chileans simply ended up residing in those areas with higher or lower levels of wage/income gap percentage due to other factors.
Demographics Similar to Chileans by Wage/Income Gap
In terms of wage/income gap, the demographic groups most similar to Chileans are Immigrants from Jordan (26.3%, a difference of 0.0%), Immigrants from Malaysia (26.3%, a difference of 0.010%), Immigrants from Bulgaria (26.3%, a difference of 0.020%), Immigrants from Western Asia (26.3%, a difference of 0.060%), and Zimbabwean (26.3%, a difference of 0.070%).
| Demographics | Rating | Rank | Wage/Income Gap |
| Palestinians | 29.9 /100 | #187 | Fair 26.1% |
| Immigrants from Egypt | 29.9 /100 | #188 | Fair 26.1% |
| Immigrants from Moldova | 26.6 /100 | #189 | Fair 26.2% |
| Immigrants from Croatia | 24.8 /100 | #190 | Fair 26.2% |
| Immigrants from Venezuela | 24.7 /100 | #191 | Fair 26.2% |
| Immigrants from Bulgaria | 22.5 /100 | #192 | Fair 26.3% |
| Immigrants from Jordan | 22.4 /100 | #193 | Fair 26.3% |
| Chileans | 22.3 /100 | #194 | Fair 26.3% |
| Immigrants from Malaysia | 22.2 /100 | #195 | Fair 26.3% |
| Immigrants from Western Asia | 21.7 /100 | #196 | Fair 26.3% |
| Zimbabweans | 21.6 /100 | #197 | Fair 26.3% |
| Venezuelans | 21.5 /100 | #198 | Fair 26.3% |
| Dutch West Indians | 21.0 /100 | #199 | Fair 26.3% |
| Delaware | 20.9 /100 | #200 | Fair 26.3% |
| Immigrants from Syria | 19.3 /100 | #201 | Poor 26.4% |
Chilean Wage/Income Gap Correlation Summary
| Measurement | Chilean Data | Wage/Income Gap Data |
| Minimum | 0.054% | 1.3% |
| Maximum | 21.3% | 69.3% |
| Range | 21.2% | 68.1% |
| Mean | 4.1% | 29.8% |
| Median | 3.0% | 27.8% |
| Interquartile 25% (IQ1) | 1.5% | 21.7% |
| Interquartile 75% (IQ3) | 5.0% | 36.7% |
| Interquartile Range (IQR) | 3.5% | 15.0% |
| Standard Deviation (Sample) | 4.0% | 13.9% |
| Standard Deviation (Population) | 3.9% | 13.7% |
Correlation Details
| Chilean Percentile | Sample Size | Wage/Income Gap |
[ 0.0% - 0.5% ] 0.054% | 182,423,345 | 24.1% |
[ 0.0% - 0.5% ] 0.17% | 41,285,006 | 26.3% |
[ 0.0% - 0.5% ] 0.30% | 15,249,714 | 26.4% |
[ 0.0% - 0.5% ] 0.42% | 6,586,432 | 29.7% |
[ 0.5% - 1.0% ] 0.54% | 3,912,024 | 28.6% |
[ 0.5% - 1.0% ] 0.67% | 2,215,959 | 27.3% |
[ 0.5% - 1.0% ] 0.80% | 1,578,554 | 27.1% |
[ 0.5% - 1.0% ] 0.92% | 1,010,307 | 24.2% |
[ 1.0% - 1.5% ] 1.04% | 667,383 | 28.2% |
[ 1.0% - 1.5% ] 1.16% | 512,736 | 30.4% |
[ 1.0% - 1.5% ] 1.28% | 333,408 | 28.9% |
[ 1.0% - 1.5% ] 1.40% | 130,955 | 32.5% |
[ 1.5% - 2.0% ] 1.53% | 93,560 | 27.4% |
[ 1.5% - 2.0% ] 1.66% | 125,178 | 26.7% |
[ 1.5% - 2.0% ] 1.78% | 83,673 | 26.7% |
[ 1.5% - 2.0% ] 1.88% | 78,350 | 32.1% |
[ 2.0% - 2.5% ] 2.00% | 34,186 | 35.2% |
[ 2.0% - 2.5% ] 2.15% | 21,992 | 19.4% |
[ 2.0% - 2.5% ] 2.24% | 40,477 | 22.9% |
[ 2.0% - 2.5% ] 2.40% | 15,299 | 32.6% |
[ 2.0% - 2.5% ] 2.49% | 10,114 | 38.4% |
[ 2.5% - 3.0% ] 2.62% | 1,907 | 40.6% |
[ 2.5% - 3.0% ] 2.72% | 16,418 | 15.7% |
[ 2.5% - 3.0% ] 2.93% | 9,503 | 23.3% |
[ 3.0% - 3.5% ] 3.01% | 19,160 | 17.4% |
[ 3.0% - 3.5% ] 3.07% | 29,211 | 62.3% |
[ 3.0% - 3.5% ] 3.21% | 8,104 | 37.3% |
[ 3.0% - 3.5% ] 3.35% | 20,448 | 6.3% |
[ 3.0% - 3.5% ] 3.50% | 2,573 | 52.9% |
[ 3.5% - 4.0% ] 3.64% | 2,826 | 17.9% |
[ 3.5% - 4.0% ] 3.98% | 19,917 | 26.5% |
[ 4.0% - 4.5% ] 4.08% | 28,875 | 19.8% |
[ 4.0% - 4.5% ] 4.26% | 2,631 | 48.6% |
[ 4.5% - 5.0% ] 4.50% | 3,620 | 21.7% |
[ 4.5% - 5.0% ] 4.60% | 14,361 | 18.6% |
[ 4.5% - 5.0% ] 4.69% | 916 | 46.5% |
[ 4.5% - 5.0% ] 4.80% | 1,104 | 38.2% |
[ 4.5% - 5.0% ] 4.99% | 1,022 | 34.0% |
[ 5.0% - 5.5% ] 5.40% | 722 | 69.3% |
[ 5.5% - 6.0% ] 5.68% | 3,943 | 21.4% |
[ 5.5% - 6.0% ] 5.99% | 1,904 | 36.7% |
[ 6.5% - 7.0% ] 6.64% | 4,169 | 30.8% |
[ 7.5% - 8.0% ] 7.62% | 8,450 | 3.5% |
[ 7.5% - 8.0% ] 7.95% | 1,622 | 48.0% |
[ 8.5% - 9.0% ] 8.81% | 7,307 | 3.9% |
[ 9.0% - 9.5% ] 9.49% | 2,612 | 1.3% |
[ 9.5% - 10.0% ] 9.70% | 1,732 | 20.1% |
[ 12.0% - 12.5% ] 12.30% | 732 | 32.4% |
[ 14.0% - 14.5% ] 14.21% | 957 | 52.4% |
[ 21.0% - 21.5% ] 21.27% | 757 | 48.2% |