Chilean College, Under 1 year

COMPARE

Chilean
Race
Ancestry
AfghanAfricanAlaska NativeAlaskan AthabascanAlbanianAleutAlsatianAmericanApacheArabArapahoArgentineanArmenianAssyrian/Chaldean/SyriacAustralianAustrianBahamianBangladeshiBarbadianBasqueBelgianBelizeanBermudanBhutaneseBlackfeetBolivianBrazilianBritishBritish West IndianBulgarianBurmeseCajunCambodianCanadianCape VerdeanCarpatho RusynCelticCentral AmericanCentral American IndianCherokeeCheyenneChickasawChileanChineseChippewaChoctawColombianColvilleComancheCosta RicanCreeCreekCroatianCrowCubanCypriotCzechCzechoslovakianDanishDelawareDominicanDutchDutch West IndianEastern EuropeanEcuadorianEgyptianEnglishEstonianEthiopianEuropeanFijianFilipinoFinnishFrenchFrench American IndianFrench CanadianGermanGerman RussianGhanaianGreekGuamanian/ChamorroGuatemalanGuyaneseHaitianHmongHonduranHopiHoumaHungarianIcelanderIndian (Asian)IndonesianInupiatIranianIraqiIrishIroquoisIsraeliItalianJamaicanJapaneseJordanianKenyanKiowaKoreanLaotianLatvianLebaneseLiberianLithuanianLumbeeLuxembourgerMacedonianMalaysianMalteseMarshalleseMenomineeMexicanMexican American IndianMongolianMoroccanNative HawaiianNavajoNepaleseNew ZealanderNicaraguanNigerianNorthern EuropeanNorwegianOkinawanOsageOttawaPaiutePakistaniPalestinianPanamanianParaguayanPennsylvania GermanPeruvianPimaPolishPortuguesePotawatomiPuebloPuerto RicanPuget Sound SalishRomanianRussianSalvadoranSamoanScandinavianScotch-IrishScottishSeminoleSenegaleseSerbianShoshoneSierra LeoneanSiouxSlavicSlovakSloveneSomaliSouth AfricanSouth AmericanSouth American IndianSoviet UnionSpaniardSpanishSpanish AmericanSpanish American IndianSri LankanSubsaharan AfricanSudaneseSwedishSwissSyrianTaiwaneseThaiTlingit-HaidaTohono O'OdhamTonganTrinidadian and TobagonianTsimshianTurkishU.S. Virgin IslanderUgandanUkrainianUruguayanUteVenezuelanVietnameseWelshWest IndianYakamaYaquiYugoslavianYumanYup'ikZimbabwean
Immigration
NonimmigrantsImmigrantsAfghanistanAfricaAlbaniaArgentinaArmeniaAsiaAustraliaAustriaBahamasBangladeshBarbadosBelarusBelgiumBelizeBoliviaBosnia and HerzegovinaBrazilBulgariaBurma/MyanmarCabo VerdeCambodiaCameroonCanadaCaribbeanCentral AmericaChileChinaColombiaCongoCosta RicaCroatiaCubaCzechoslovakiaDenmarkDominicaDominican RepublicEastern AfricaEastern AsiaEastern EuropeEcuadorEgyptEl SalvadorEnglandEritreaEthiopiaEuropeFijiFranceGermanyGhanaGreeceGrenadaGuatemalaGuyanaHaitiHondurasHong KongHungaryIndiaIndonesiaIranIraqIrelandIsraelItalyJamaicaJapanJordanKazakhstanKenyaKoreaKuwaitLaosLatin AmericaLatviaLebanonLiberiaLithuaniaMalaysiaMexicoMicronesiaMiddle AfricaMoldovaMoroccoNepalNetherlandsNicaraguaNigeriaNorth AmericaNorth MacedoniaNorthern AfricaNorthern EuropeNorwayOceaniaPakistanPanamaPeruPhilippinesPolandPortugalRomaniaRussiaSaudi ArabiaScotlandSenegalSerbiaSierra LeoneSingaporeSomaliaSouth AfricaSouth AmericaSouth Central AsiaSouth Eastern AsiaSouthern EuropeSpainSri LankaSt. Vincent and the GrenadinesSudanSwedenSwitzerlandSyriaTaiwanThailandTrinidad and TobagoTurkeyUgandaUkraineUruguayUzbekistanVenezuelaVietnamWest IndiesWestern AfricaWestern AsiaWestern EuropeYemenZaireZimbabweAzores
Select to Compare
Race
Ancestry
AfghanAfricanAlaska NativeAlaskan AthabascanAlbanianAleutAlsatianAmericanApacheArabArapahoArgentineanArmenianAssyrian/Chaldean/SyriacAustralianAustrianBahamianBangladeshiBarbadianBasqueBelgianBelizeanBermudanBhutaneseBlackfeetBolivianBrazilianBritishBritish West IndianBulgarianBurmeseCajunCambodianCanadianCape VerdeanCarpatho RusynCelticCentral AmericanCentral American IndianCherokeeCheyenneChickasawChineseChippewaChoctawColombianColvilleComancheCosta RicanCreeCreekCroatianCrowCubanCypriotCzechCzechoslovakianDanishDelawareDominicanDutchDutch West IndianEastern EuropeanEcuadorianEgyptianEnglishEstonianEthiopianEuropeanFijianFilipinoFinnishFrenchFrench American IndianFrench CanadianGermanGerman RussianGhanaianGreekGuamanian/ChamorroGuatemalanGuyaneseHaitianHmongHonduranHopiHoumaHungarianIcelanderIndian (Asian)IndonesianInupiatIranianIraqiIrishIroquoisIsraeliItalianJamaicanJapaneseJordanianKenyanKiowaKoreanLaotianLatvianLebaneseLiberianLithuanianLumbeeLuxembourgerMacedonianMalaysianMalteseMarshalleseMenomineeMexicanMexican American IndianMongolianMoroccanNative HawaiianNavajoNepaleseNew ZealanderNicaraguanNigerianNorthern EuropeanNorwegianOkinawanOsageOttawaPaiutePakistaniPalestinianPanamanianParaguayanPennsylvania GermanPeruvianPimaPolishPortuguesePotawatomiPuebloPuerto RicanPuget Sound SalishRomanianRussianSalvadoranSamoanScandinavianScotch-IrishScottishSeminoleSenegaleseSerbianShoshoneSierra LeoneanSiouxSlavicSlovakSloveneSomaliSouth AfricanSouth AmericanSouth American IndianSoviet UnionSpaniardSpanishSpanish AmericanSpanish American IndianSri LankanSubsaharan AfricanSudaneseSwedishSwissSyrianTaiwaneseThaiTlingit-HaidaTohono O'OdhamTonganTrinidadian and TobagonianTsimshianTurkishU.S. Virgin IslanderUgandanUkrainianUruguayanUteVenezuelanVietnameseWelshWest IndianYakamaYaquiYugoslavianYumanYup'ikZimbabwean
Immigration
NonimmigrantsImmigrantsAfghanistanAfricaAlbaniaArgentinaArmeniaAsiaAustraliaAustriaBahamasBangladeshBarbadosBelarusBelgiumBelizeBoliviaBosnia and HerzegovinaBrazilBulgariaBurma/MyanmarCabo VerdeCambodiaCameroonCanadaCaribbeanCentral AmericaChileChinaColombiaCongoCosta RicaCroatiaCubaCzechoslovakiaDenmarkDominicaDominican RepublicEastern AfricaEastern AsiaEastern EuropeEcuadorEgyptEl SalvadorEnglandEritreaEthiopiaEuropeFijiFranceGermanyGhanaGreeceGrenadaGuatemalaGuyanaHaitiHondurasHong KongHungaryIndiaIndonesiaIranIraqIrelandIsraelItalyJamaicaJapanJordanKazakhstanKenyaKoreaKuwaitLaosLatin AmericaLatviaLebanonLiberiaLithuaniaMalaysiaMexicoMicronesiaMiddle AfricaMoldovaMoroccoNepalNetherlandsNicaraguaNigeriaNorth AmericaNorth MacedoniaNorthern AfricaNorthern EuropeNorwayOceaniaPakistanPanamaPeruPhilippinesPolandPortugalRomaniaRussiaSaudi ArabiaScotlandSenegalSerbiaSierra LeoneSingaporeSomaliaSouth AfricaSouth AmericaSouth Central AsiaSouth Eastern AsiaSouthern EuropeSpainSri LankaSt. Vincent and the GrenadinesSudanSwedenSwitzerlandSyriaTaiwanThailandTrinidad and TobagoTurkeyUgandaUkraineUruguayUzbekistanVenezuelaVietnamWest IndiesWestern AfricaWestern AsiaWestern EuropeYemenZaireZimbabweAzores
College, Under 1 year
Income
Poverty
Unemployment
Labor Participation
Family Structure
Vehicle Availability
Education Level
Disability

Chilean College, Under 1 year
Exceptional

67.6%
COLLEGE, UNDER 1 YEAR
95.3/ 100
METRIC RATING
114th/ 347
METRIC RANK

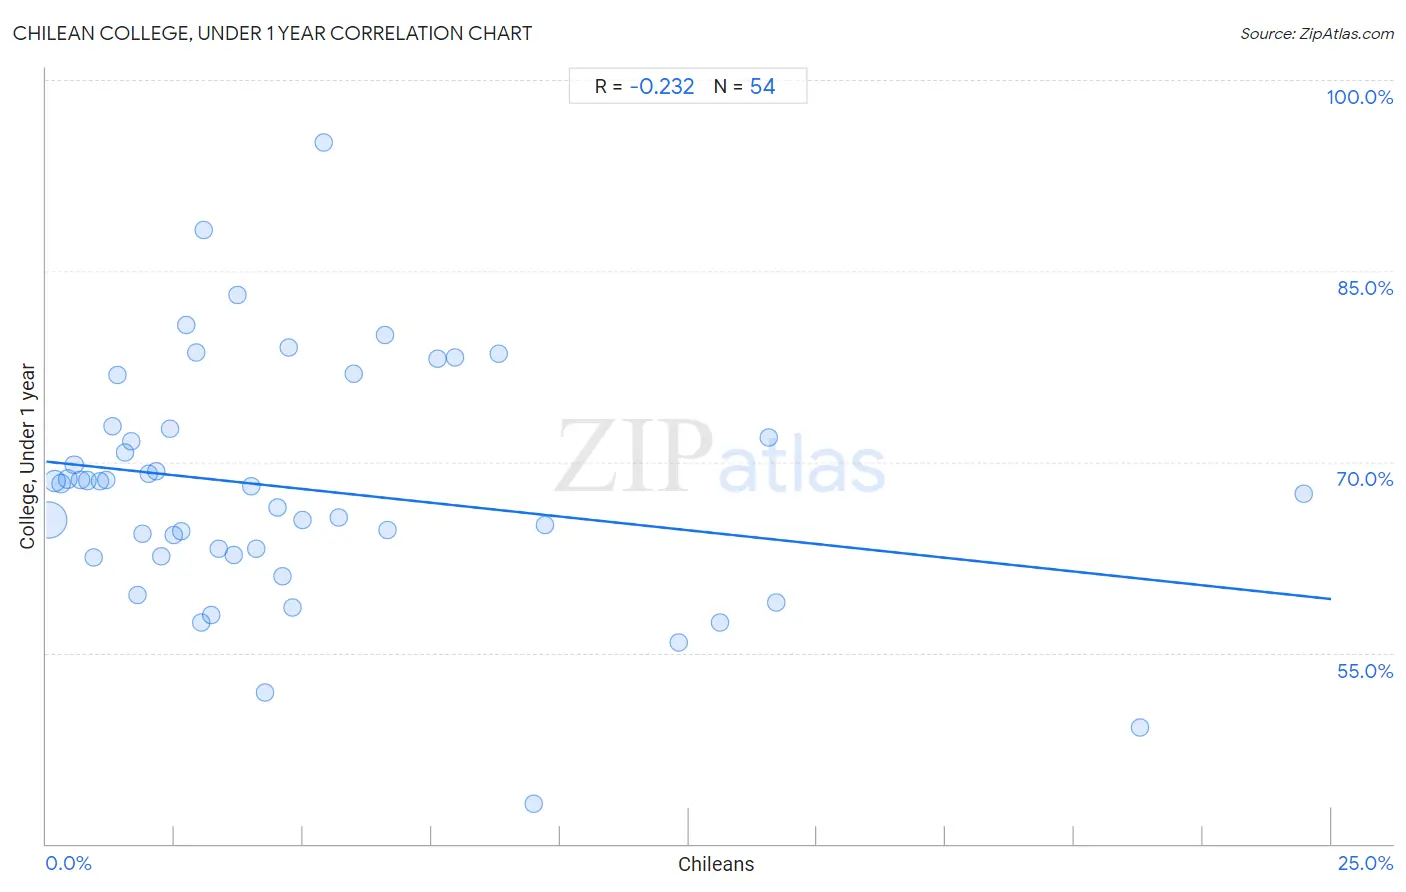
Chilean College, Under 1 year Correlation Chart

The statistical analysis conducted on geographies consisting of 256,681,764 people shows a weak negative correlation between the proportion of Chileans and percentage of population with at least college, under 1 year education in the United States with a correlation coefficient (R) of -0.232 and weighted average of 67.6%. On average, for every 1% (one percent) increase in Chileans within a typical geography, there is a decrease of 0.43% in percentage of population with at least college, under 1 year education.
Chilean College, Under 1 year
It is essential to understand that the correlation between the percentage of Chileans and percentage of population with at least college, under 1 year education does not imply a direct cause-and-effect relationship. It remains uncertain whether the presence of Chileans influences an upward or downward trend in the level of percentage of population with at least college, under 1 year education within an area, or if Chileans simply ended up residing in those areas with higher or lower levels of percentage of population with at least college, under 1 year education due to other factors.

Demographics Similar to Chileans by College, Under 1 year

In terms of college, under 1 year, the demographic groups most similar to Chileans are Basque (67.6%, a difference of 0.010%), Syrian (67.6%, a difference of 0.080%), Immigrants from Nepal (67.5%, a difference of 0.090%), Macedonian (67.6%, a difference of 0.10%), and Pakistani (67.5%, a difference of 0.11%).
DemographicsRating | RankCollege, Under 1 year
Austrians
96.4
/100
|
#107
Exceptional
67.8%
Immigrants from Egypt
96.0
/100
|
#108
Exceptional
67.7%
Scandinavians
95.8
/100
|
#109
Exceptional
67.7%
Assyrians/Chaldeans/Syriacs
95.8
/100
|
#110
Exceptional
67.7%
Ukrainians
95.8
/100
|
#111
Exceptional
67.7%
Macedonians
95.7
/100
|
#112
Exceptional
67.6%
Syrians
95.6
/100
|
#113
Exceptional
67.6%
Chileans
95.3
/100
|
#114
Exceptional
67.6%
Basques
95.2
/100
|
#115
Exceptional
67.6%
Immigrants from Nepal
94.9
/100
|
#116
Exceptional
67.5%
Pakistanis
94.8
/100
|
#117
Exceptional
67.5%
Immigrants from Ukraine
94.7
/100
|
#118
Exceptional
67.5%
Lebanese
94.6
/100
|
#119
Exceptional
67.5%
Serbians
93.9
/100
|
#120
Exceptional
67.4%
Slovenes
93.3
/100
|
#121
Exceptional
67.3%

Chilean College, Under 1 year Correlation Summary

MeasurementChilean DataCollege, Under 1 year Data
Minimum0.054%43.2%
Maximum24.5%95.0%
Range24.4%51.9%
Mean4.9%67.9%
Median3.3%68.2%
Interquartile 25% (IQ1)1.7%62.7%
Interquartile 75% (IQ3)6.0%72.6%
Interquartile Range (IQR)4.3%10.0%
Standard Deviation (Sample)5.0%9.4%
Standard Deviation (Population)5.0%9.3%

Correlation Details

Chilean PercentileSample SizeCollege, Under 1 year
[
0.0%
-
0.5%
]
0.054%
182,425,02165.4%
[
0.0%
-
0.5%
]
0.17%
41,287,49468.5%
[
0.0%
-
0.5%
]
0.30%
15,259,24168.3%
[
0.0%
-
0.5%
]
0.42%
6,590,02868.6%
[
0.5%
-
1.0%
]
0.54%
3,916,16369.8%
[
0.5%
-
1.0%
]
0.66%
2,216,33668.6%
[
0.5%
-
1.0%
]
0.80%
1,585,60168.5%
[
0.5%
-
1.0%
]
0.92%
1,012,65262.5%
[
1.0%
-
1.5%
]
1.04%
672,04268.5%
[
1.0%
-
1.5%
]
1.16%
515,32768.5%
[
1.0%
-
1.5%
]
1.28%
334,37172.8%
[
1.0%
-
1.5%
]
1.40%
131,59376.8%
[
1.5%
-
2.0%
]
1.53%
93,56070.8%
[
1.5%
-
2.0%
]
1.66%
126,14271.6%
[
1.5%
-
2.0%
]
1.78%
87,57159.5%
[
1.5%
-
2.0%
]
1.88%
80,99164.4%
[
2.0%
-
2.5%
]
2.00%
35,88169.1%
[
2.0%
-
2.5%
]
2.15%
21,99269.2%
[
2.0%
-
2.5%
]
2.24%
40,47762.6%
[
2.0%
-
2.5%
]
2.40%
15,29972.6%
[
2.0%
-
2.5%
]
2.49%
10,11464.2%
[
2.5%
-
3.0%
]
2.62%
1,90764.6%
[
2.5%
-
3.0%
]
2.72%
16,41880.7%
[
2.5%
-
3.0%
]
2.93%
9,50378.6%
[
3.0%
-
3.5%
]
3.01%
19,16057.4%
[
3.0%
-
3.5%
]
3.07%
29,21188.2%
[
3.0%
-
3.5%
]
3.21%
8,10458.0%
[
3.0%
-
3.5%
]
3.35%
20,44863.2%
[
3.5%
-
4.0%
]
3.64%
3,56762.7%
[
3.5%
-
4.0%
]
3.72%
3,03583.1%
[
3.5%
-
4.0%
]
3.98%
19,91768.1%
[
4.0%
-
4.5%
]
4.08%
29,40663.2%
[
4.0%
-
4.5%
]
4.26%
2,63151.9%
[
4.5%
-
5.0%
]
4.50%
3,62066.5%
[
4.5%
-
5.0%
]
4.60%
14,36161.0%
[
4.5%
-
5.0%
]
4.73%
3,74579.0%
[
4.5%
-
5.0%
]
4.80%
1,10458.6%
[
4.5%
-
5.0%
]
4.99%
1,02265.4%
[
5.0%
-
5.5%
]
5.40%
1,25995.0%
[
5.5%
-
6.0%
]
5.68%
3,94365.6%
[
5.5%
-
6.0%
]
5.99%
1,90476.9%
[
6.5%
-
7.0%
]
6.60%
98580.0%
[
6.5%
-
7.0%
]
6.64%
4,16964.6%
[
7.5%
-
8.0%
]
7.62%
8,45078.1%
[
7.5%
-
8.0%
]
7.95%
1,62278.2%
[
8.5%
-
9.0%
]
8.81%
7,30778.5%
[
9.0%
-
9.5%
]
9.49%
2,61243.2%
[
9.5%
-
10.0%
]
9.70%
1,73265.1%
[
12.0%
-
12.5%
]
12.30%
73255.8%
[
13.0%
-
13.5%
]
13.11%
12257.4%
[
14.0%
-
14.5%
]
14.06%
6471.9%
[
14.0%
-
14.5%
]
14.21%
95759.0%
[
21.0%
-
21.5%
]
21.27%
75749.1%
[
24.0%
-
24.5%
]
24.47%
9467.5%